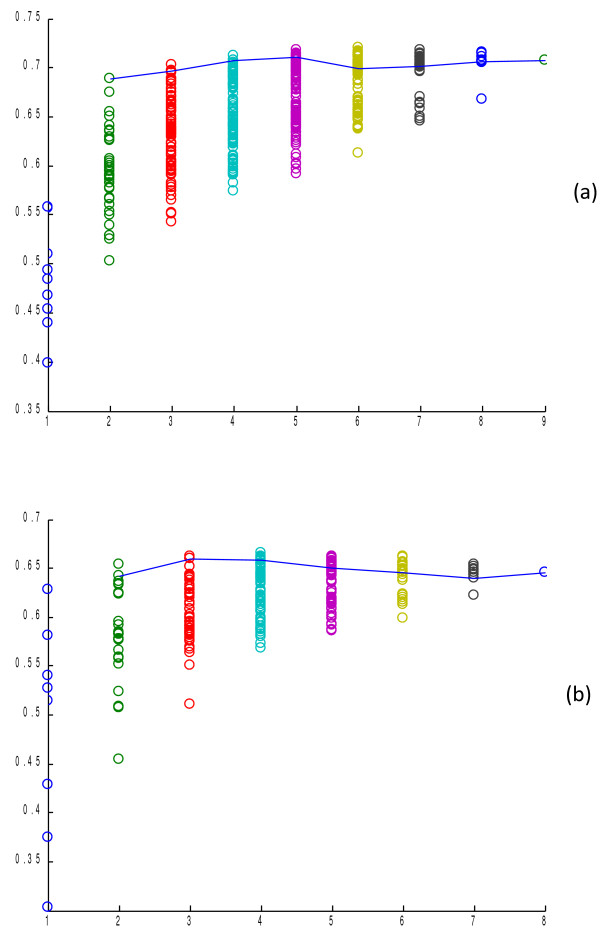
Figure 1 .
Prediction performance of the logistic regression ensemble methods with K individual predictors selected by exhaustive search. (a) Performance on the Yeast Low-Res dataset, (b) Performance on the Human dataset. Each dot represents one combination of predictors. The number of predictors is annotated on the X axis. The performance of the logistic regression ensemble method is annotated on the Y axis. The dots connected by the line represent the combinations of predictors determined by the minimalist algorithm for different K values.

