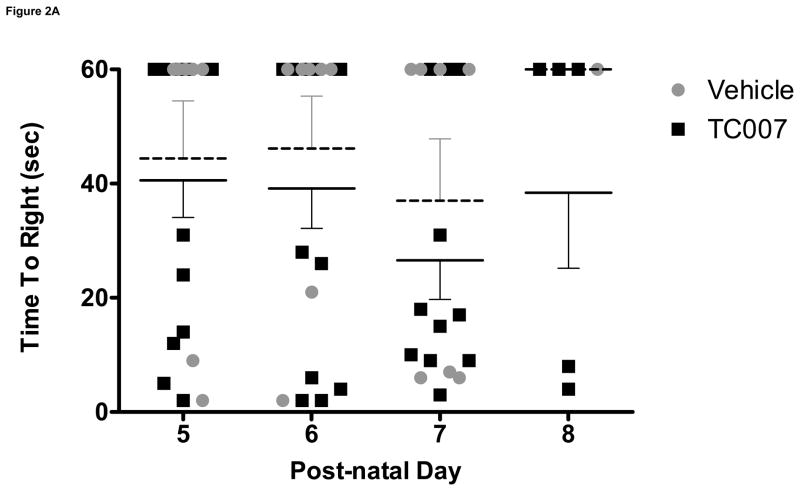
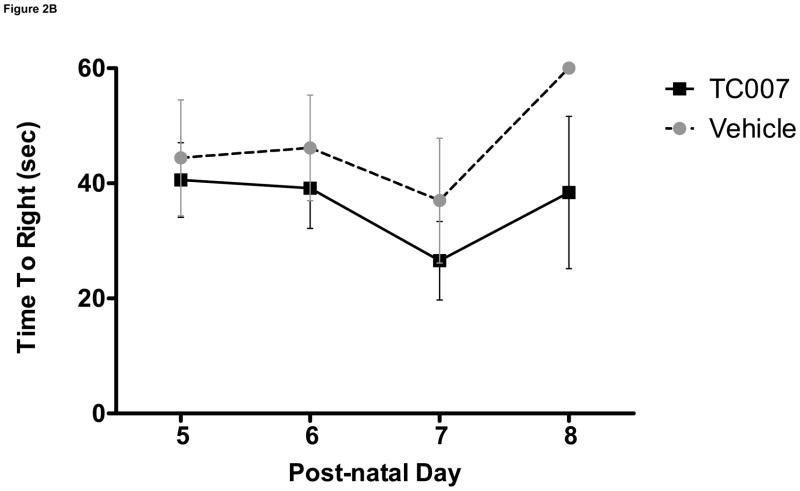
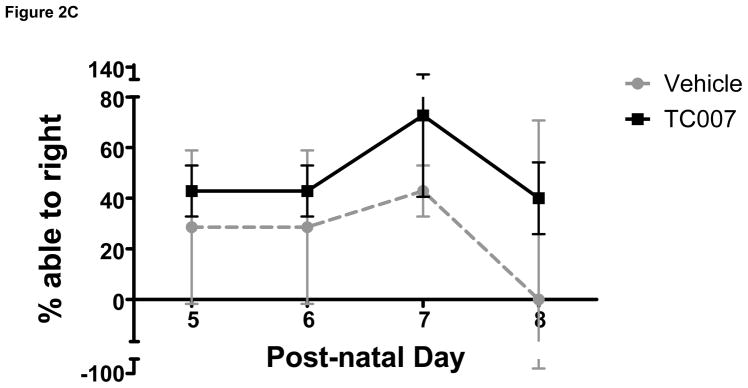
Fig. 2.
Gross-motor function of severe SMA TC007-treated mice not significantly increased as compared to vehicle-treated (Student’s T Test). (A) Each grey circle (vehicle) or black square (TC007) represents an individual mouse plotted per day, post-natal days 5 through 8 (N for each day TC007: 14, 14, 11, 5 and vehicle: 7, 7, 7, 1 respectively). Lines represent the average of each group (TC007: black bar, vehicle: grey dotted bar) and bars represent SEM. (B) TC007-treated mice (line) on average not significantly different than vehicle-treated (dotted) littermates. Error bars represent SEM. (C) TC007-treated (black line) mice are not significantly different in ability to right on average than vehicle-treated (grey dotted). Bars represent Standard Deviation.


