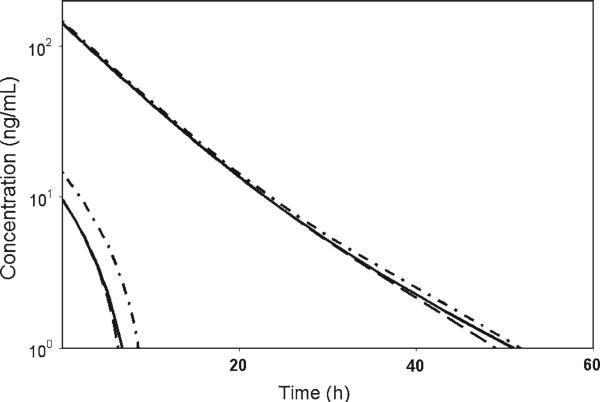
Fig. 1.
Simulation of the pharmacokinetic profile with 1 and 10 μg kg–1 IV doses using the RB/QSS TMDD model (solid line), the corrected M–M model (dash line), and the original M–M model (dash-dot line). Parameters for TMDD model are listed in Table 1. M–M profiles were simulated with the following parameter values: kel = 0.0382 h–1, V = 68.3 ml kg–1, kpt = 0.0806 h–1, ktp = 0.0148 h–1, Vmax = 59.0795 ng kg–1 h–1, Km = 0.131 ng ml–1

