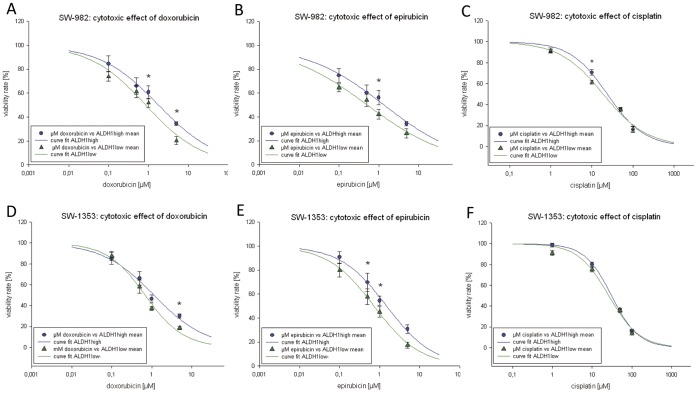
Figure 5. Analysis of the cytotoxic effect of chemotherapeutic agents on ALDH1high and ALDH1low populations sorted from (A–C) SW-982 and (D–F) SW-1353 cells.
Both subopulations were treated with 0–5.0 µM doxorubicin, 0–5.0 µM epirubicin, 1–100 µM cisplatin, and measured after 48 h. Mean value ±SD of all measurements was fitted according the Hill equation. Significant differences on the individual concentrations were incorporated in the curves.

