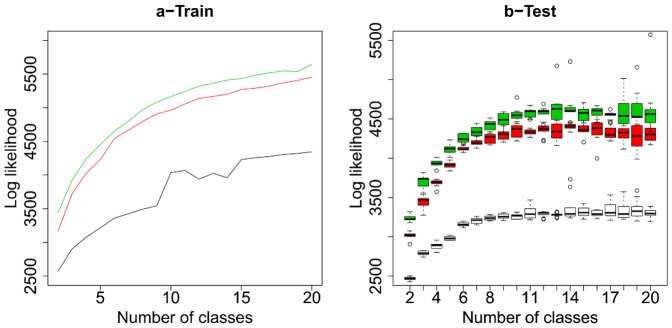
Figure 3. Model fitting.
Train (a) and test (b) log likelihood of the negative control data for the two proposed models, and the baseline, varying the number of phenotypic classes. Green corresponds to the copula based model, red corresponds to the gaussian model, and black corresponds to the baseline model. For training log likelihood, we picked the best model among 10 random restarts of the algorithm. For the test log likelihood, the boxes account for the variability among ten different splits of the data in a cross validation setting. Given a data split, for each fold and each number of classes, we picked the best model among 5 random restarts of the algorithm.

