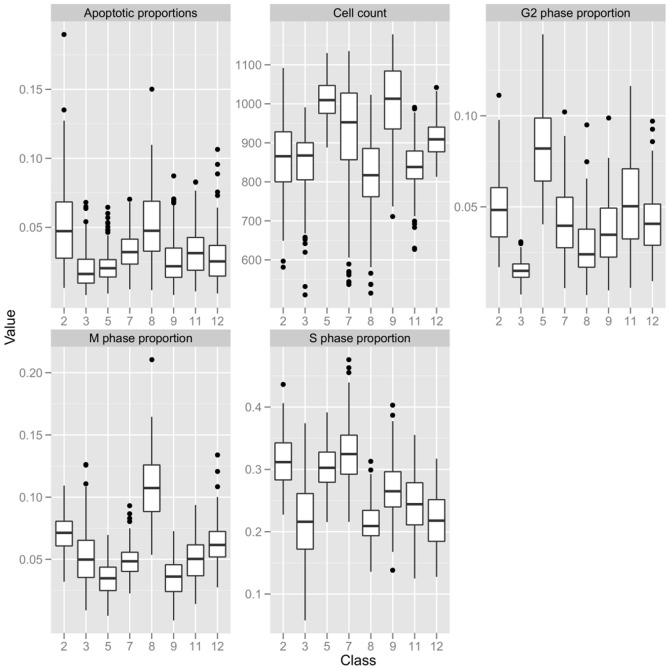
Figure 7. Relation between classes and population descriptors.
The classes are represented on the  axis. For each class, the boxplot shows the distribution of population descriptors among the fields of this class. Outlier classes were removed. The cell count descriptor has a similar distribution for classes 2 and 3, but other descriptors also allow to differentiate them. Similarly, classes 3 and 5 have have a similar proportion of apoptotic cells, but other descriptors also allow to differentiate them. More generally, each descriptor separates different classes. This suggests that there is no redundancy between population descriptors, and that the classes reflect the combinatorial association between population descriptors.

