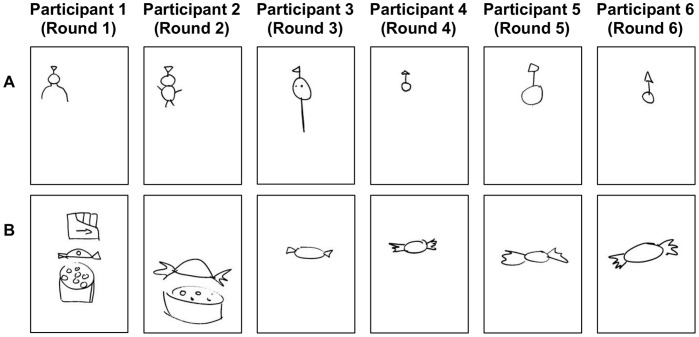
Figure 2. Example drawings of one of the target concepts (purple) from two microsocieties.
Panels A and B each display the drawings of one chain of participants. Participant 5 joined the test group in round 2 and participant 6 joined the test group in round 3 so neither witnessed the signs produced in the initial rounds (see Table 1). Each drawing was completed on a sheet of A4 paper and they are displayed to scale here.

