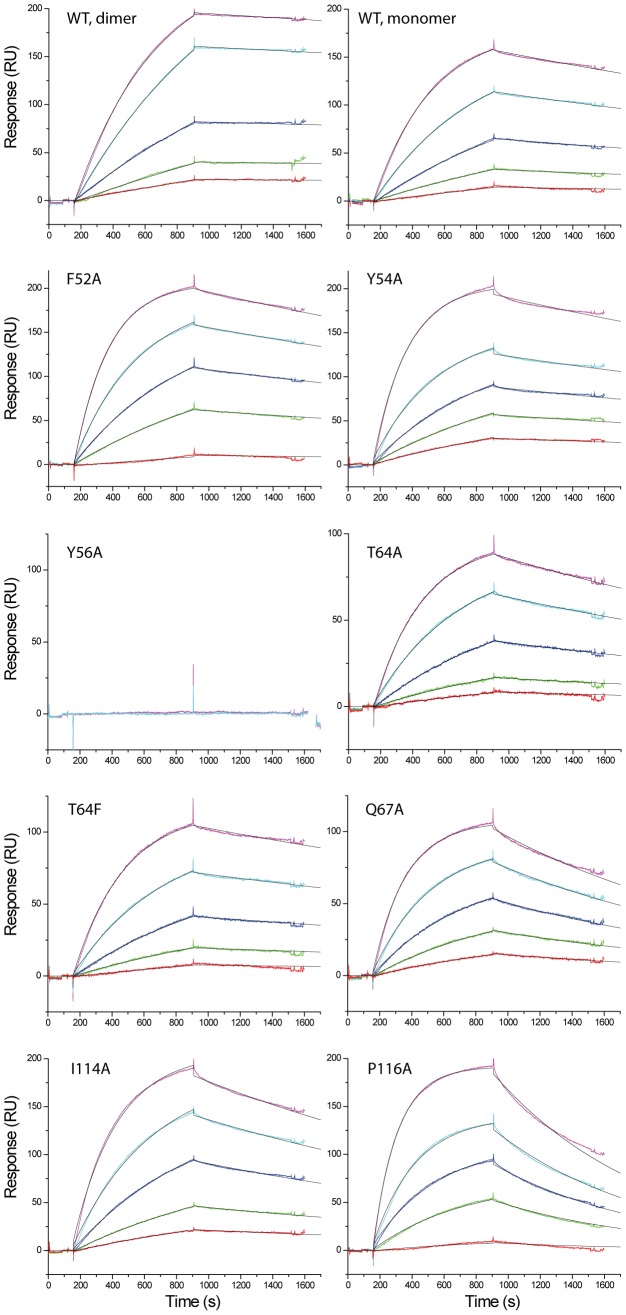
Figure 8. Kinetic analyses of the binding of IL18 with YLDV-IL18BP.
SPR analysis was performed as described in Figure 7 with YLDV-IL18BP at 5 different concentrations. The binding curves were globally fitted with BiaEvaluation software to a 1∶1 binding model. The colored and black lines are the actual responses in RU and globally fitted curves, respectively.

