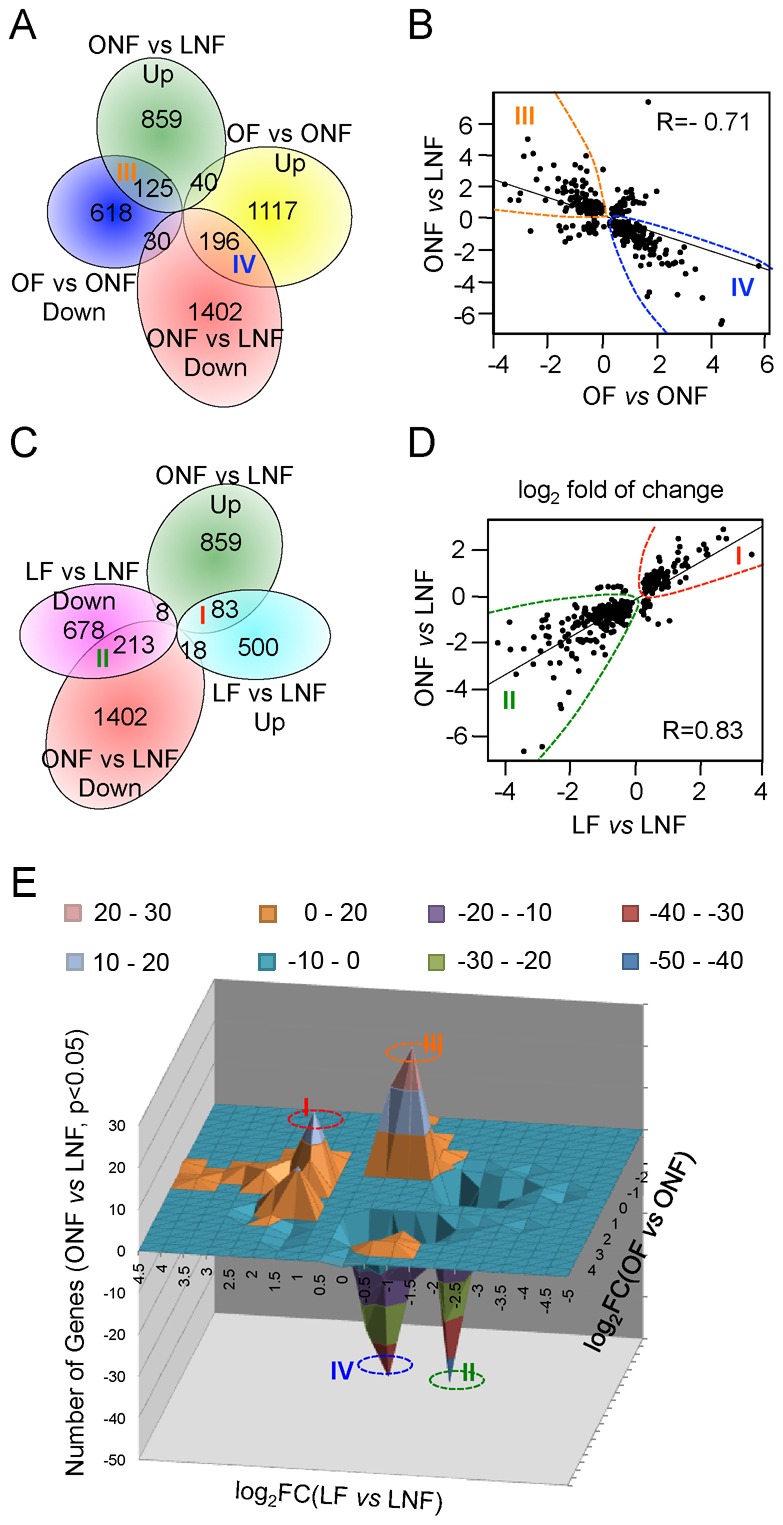
Figure 3. Dynamic regulation of the hepatic ER translatome by fasting.

(A) Illustration of the overlap between translatomic changes induced by the development of obesity (obese nonfasted, ONF versus lean nonfasted, LNF) and fasting in lean mice (lean fasted, LF versus lean nonfasted, LNF). (B) Correlation scatterplot of fold changes (logarithmically transformed) for commonly regulated genes induced by obesity (Y-axis) and fasting in the lean (X-axis). Each dot represents a gene that is differentially regulated in the translatome in both comparisons (ONF versus LNF and LF versus LNF). (C) Diagram illustrates the reversal of obesity-induced translatomic changes (ONF versus LNF) by overnight fasting in the obese mice (OF versus ONF). (D) Scatterplot of logarithmically transformed fold changes induced by obesity (Y-axis) and its reversal by overnight fasting (X-axis). Each dot represents a gene that is differentially regulated in both comparisons (ONF versus LNF and OF versus ONF). “R” denotes Pearson coefficiency. (E) Distribution of commonly regulated genes between ONF versus LNF and LF versus LNF or OF versus ONF. X-axis: P-values of LF versus LNF; Y-axis: P-values of OF versus ONF; Z-axis: number of genes differentially regulated in the ONF versus LNF comparison. Negative values correspond to downregulated genes. I, genes upregulated in both ONF versus LNF comparison and LF versus LNF comparison; II, genes commonly downregulated between these comparisons; III, genes upregulated in ONF versus LNF comparison but downregulated in OF versus ONF comparison; IV, genes downregulated in the ONF versus LNF comparison but upregulated in the OF versus ONF comparison.
