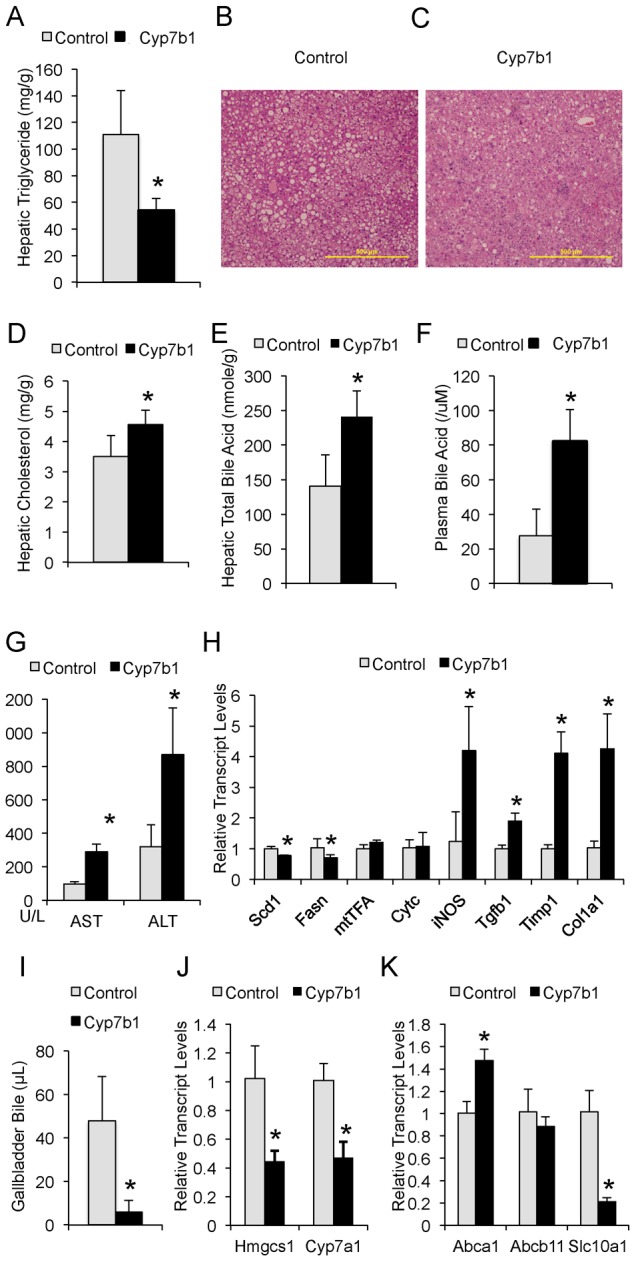
Figure 6. Cyp7b1 overexpression causes cholestasis.

(A–C) Changes of hepatic steatosis in the liver of control and experimental mice as measured by liver triglyceride levels and H&E staining. White vesicles indicate fat infiltration. (D–E) Measurement of hepatic cholesterol and bile acid levels in the control and experimental mice. (F–G) Measurement of plasma ALT/AST levels and bile acid levels from the control and experimental mice. (H) Transcript levels of genes involved in inflammation and fibrosis in the liver of control and experimental mice as measured by qPCR. (I) Measurement of total bile collected from the gallbladder of control and experimental mice after 6 hours of food withdrawal. (J–K) Measurement of transcript levels of genes involved in cholesterol and bile synthesis and transport in the liver tissues of control and experimental mice with real time, quantitative RT-PCR. “*” denotes p<0.05 (Student's t-test, n = 6 except for qPCR, in which n = 4/group).
