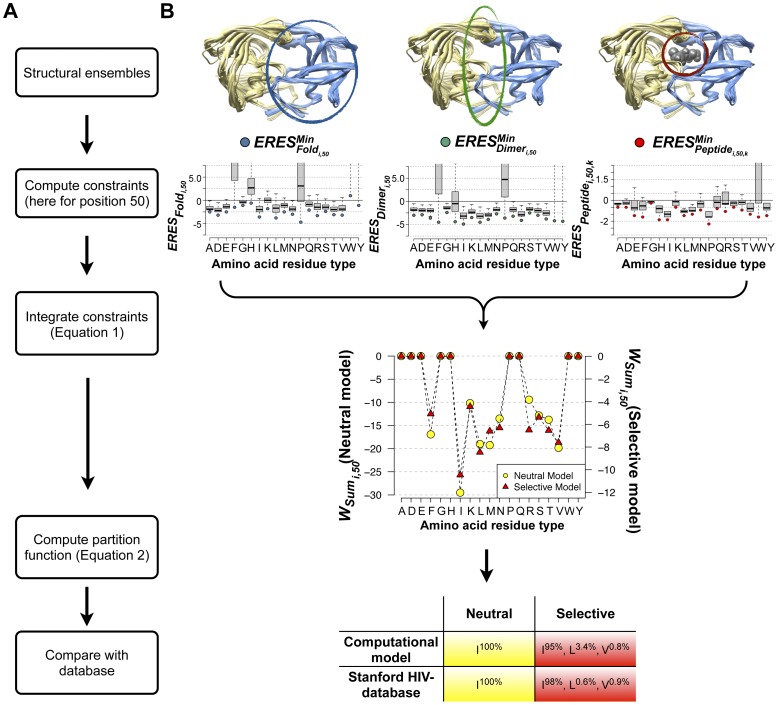
Figure 1. Computational model for predicting mutational tolerance.
(A) Flowchart illustrating key steps. (B) Example calculations for position 50 in HIV-1 protease. For each position in the protein of interest, all amino acid residue types (except cysteine) are computationally modeled onto each structure in an ensemble of backbone structures. For each mutation, the Rosetta per-residue energy contribution (ERES) is recorded for each structure. These values are depicted as boxplots showing the variation in the ERES scores calculated over the ensemble (ERESFold and ERESDimer scores are shown for 263 experimentally determined protease structures; ERESPeptide scores are shown for 19 structures with a substrate peptide bound). Next, the minimum (i.e. most favorable) ERES score observed among all structures in the ensemble is determined with respect to fold stability (left boxplot, blue circles), dimer stability (middle boxplot, green circles) and binding to 10 substrate peptides (right boxplot, red circles). These minimum scores are then weighted and summed for each point mutation to yield WSum for each position j and amino acid i (
Equation 1
). Sums are performed using either neutral or selective weights (see Table S4).  scores are combined using
Equation (2)
to give predicted frequencies for each residue type (superscript). For comparison, the mutational frequencies for position 50 observed in the Stanford HIV-1 database before and after inhibitor treatment are shown below the predicted frequencies (superscripts for each observed residue type).

