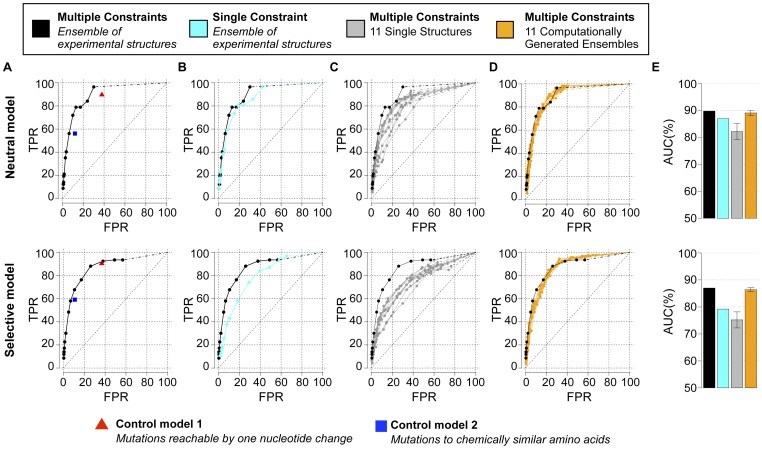
Figure 3. Model performance for protease and importance of specific model features: multiple constraints and backbone flexibility.
(A) ROC curves for predictions using three functional constraints and a crystallographic ensemble of protease structures are shown for the neutral (top) and selective (bottom) models. For reference, these curves are also duplicated in panels B–D. (B) ROC curves for predictions using fold stability as a single constraint and a crystallographic ensemble of protease structures are shown for the neutral (cyan, top) and selective (cyan, bottom) models. (C) ROC curves for predictions using three constraints and a single crystallographic protease structure are shown for the neutral (grey, top) and selective (grey, bottom) models. Curves are shown for 11 single protease structures. (D) ROC curves for predictions using three constraints and a computationally generated ensemble of protease structures are shown for the neutral (orange, top) and selective (orange, bottom) models. Curves are shown for 11 computational ensembles each generated from one of the 11 single protease structures used in (C). (E) AUC values are shown for each of the ROC curves depicted in (A–D). For ROC curves in (A–D), true positive tolerated mutations are defined as those observed with a frequency above 1% in the Stanford database (57 and 93 mutations for the neutral and selective models, respectively). The subset of all amino acids reachable by one nucleotide change and the subset of all amino acids that are chemically similar to the native are denoted by a red triangle and blue square, respectively (see text). Dashed lines connect the last ROC value (lowest frequency threshold) and the (100%, 100%) point.

