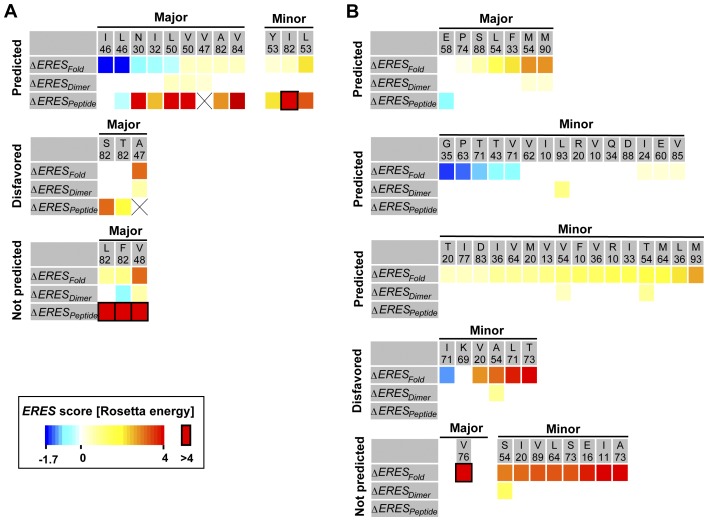
Figure 4. Predicted energetic contributions of HIV-1 protease DRMs.
(A) DRMs within 4 Å of the substrate-binding site [23]. Predicted changes in ERESFold, ERESDimer, and ERESPeptide scores are relative to the ERES scores of the native residue type. ERESPeptide scores are represented by the change in the sum of ERES scores for all 10 peptides before and after introducing the mutation. ERES scores are given in color codes, from −1.7 to 4 (blue to red), and >4 (framed red boxes) in Rosetta energy units (approximating kcal/mol), and columns are sorted in ascending order of the ERESFold scores. Mutations denoted as “Predicted" and “Not Predicted" were predicted by the selective model to have >0.01% and ≤0.01% frequencies, respectively. Mutations that required more than one nucleotide substitution are denoted as “disfavored". Boxes with “X" indicate clashes in the wild-type structure. (B) As (A), but showing DRMs outside of the substrate-binding site. Major and minor DRMs are as defined in the text.

