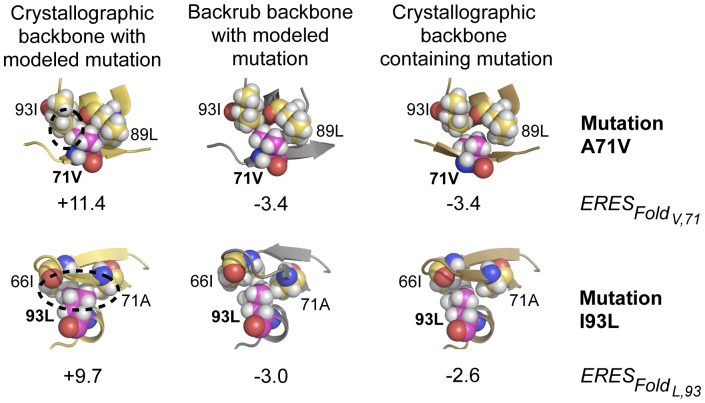
Figure 5. Structural and energetic effects of modeling backbone flexibility.
Shown are space fill representations of the environment of two mutations: A71V (top) and I93L (bottom); yellow: carbon; magenta: carbon of mutated residue; white: hydrogen; red: oxygen; blue: nitrogen. Left: Mutations A71V and I93L modeled onto a crystallographic structure that did not contain a mutation (PDB code 1VIK) result in large to moderate steric clashes (unfavorable ERES scores). Middle: The same mutations modeled onto structures that had been computationally generated using the backrub protocol; the steric clashes are relieved (negative ERES scores). Right: ERES scores and structures for experimentally determined structures that contained the A71V or I93L mutations (2FDD and 2R5P, respectively) were close to the modeled ERES scores and structures (middle). ERES scores for each structure represent only the ERESFold contribution from the single chain depicted.

