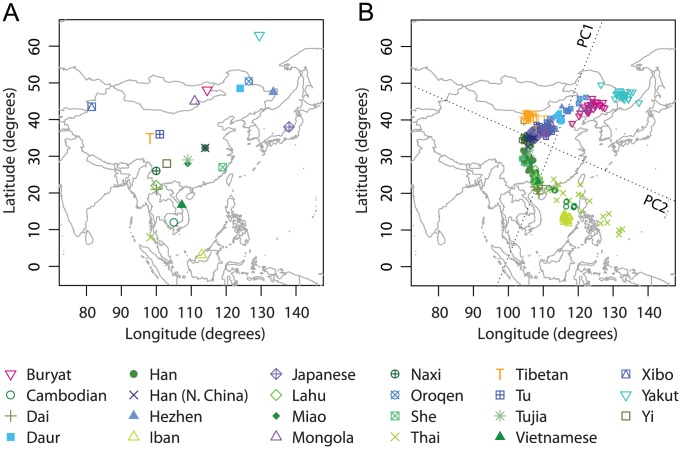
Figure 5. Procrustes analysis of genetic and geographic coordinates of East Asian populations.
(A) Geographic coordinates of 23 populations. (B) Procrustes-transformed PCA plot of genetic variation. The Procrustes analysis is based on the unprojected latitude-longitude coordinates and PC1-PC2 coordinates of 334 individuals. PC1 and PC2 are indicated by dotted lines, crossing over the centroid of all individuals. PC1 and PC2 account for 1.58% and 0.98% of the total variance, respectively. The Procrustes similarity statistic is  (
( ). The rotation angle of the PCA map is
  .
.

