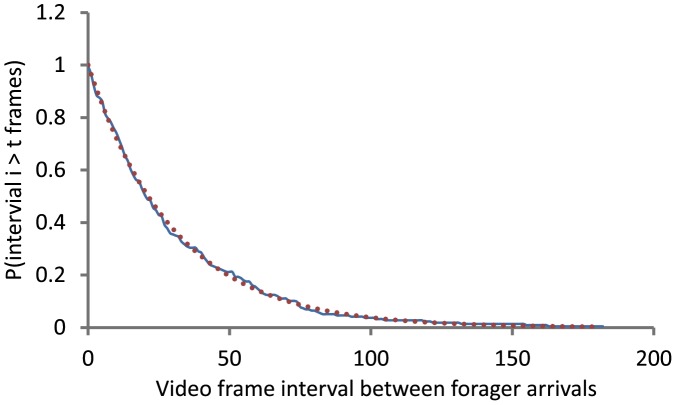
Figure 1. Poisson distribution of intervals between the arrival of successive returning foragers at the nest.
The figure shows representative data from one trial in which returning foragers were removed. Intervals are shown in video frames; each frame is 1/30 sec. The y-axis is the probability that the interval i between successive returning foragers exceeds t frames. The solid blue line corresponds to the real data and the dotted red line corresponds to the exponential fit y = e −0.0326 t with a mean separation time of 1/0.0326 or 30.67 frames, equal to 1.02 seconds.

