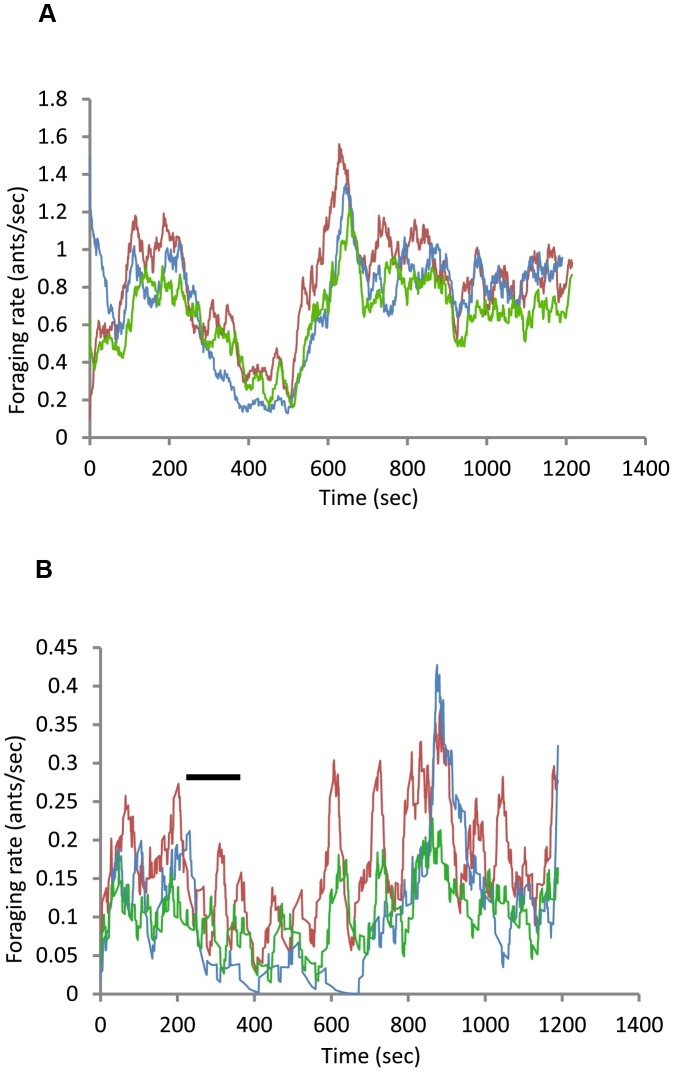
Figure 2. Comparison of observed and simulated foraging rates.
The rate of returning foragers was experimentally decreased by removing the returning foragers, leading to a decrease in the rate at which outgoing foragers left the nest. Each figure shows data from one trial. Returning foragers were removed from 240–420 sec, during the interval indicated by the horizontal black line, and then allowed to return to the nest undisturbed for the remainder of the trial. The red line shows the observed rate of returning foragers, the blue line shows the observed rate of outgoing foragers, and the green line shows the simulated rate of outgoing foragers. a, high foraging rate (mean rate returning foragers 0.807 ants/sec); b, low foraging rate (mean rate returning foragers 0.169 ants/sec).

