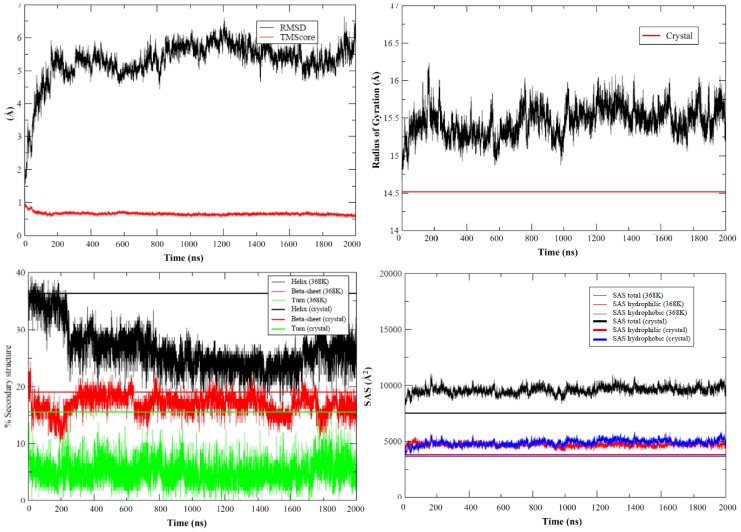
Figure 4. Evolution of different metrics along the 2 µsec unfolding simulation of apoflavodoxin at 368 K.
TOP/LEFT: All atoms root mean square deviation and TM-score from crystal structure (both in Å). TOP/RIGHT: Radii of gyration (in Å). BOTTOM/LEFT: content of secondary structure. BOTTOM/RIGHT Solvent accessible surface (total, hydrophobic and hydrophilic, all in Å2). Reference lines represent always the values found in the crystal structure (PDB code 1FTG).

