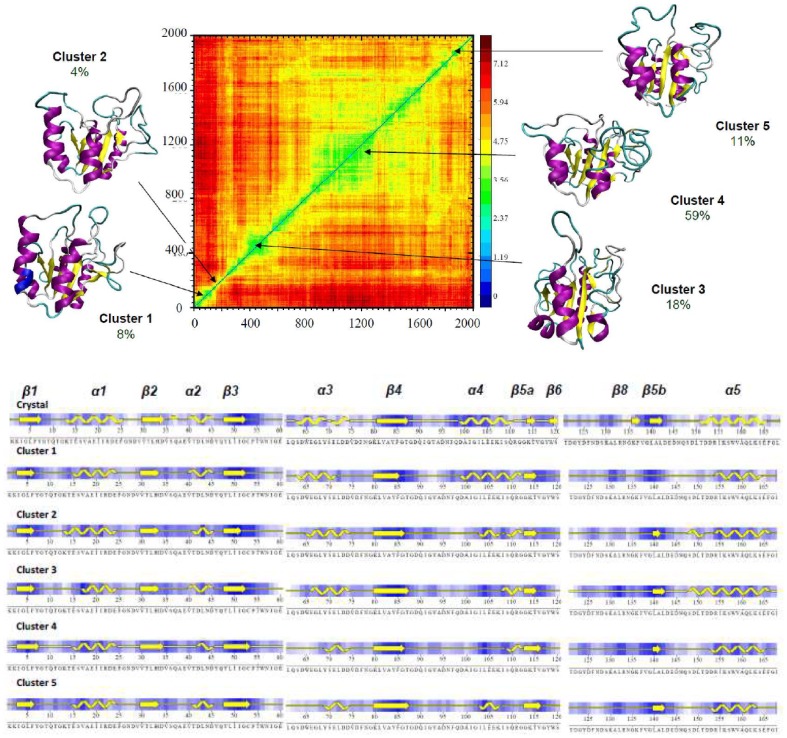
Figure 5. Cross-root mean square deviation plot for the 2 µsec unfolding simulation of apoflavodoxin at 368 K (RMSd color code is in Å).
The central structure of the different clusters (cluster radii 4.6 Å) sampled during the trajectories are projected into the cross RMSd plot. The typical secondary structure content of the structures in the different clusters is shown with a reference to X-Ray structure (PDB code 1FTG).

