
Figure 2. Summary of the evolutionary dynamics in collective-risk dilemmas.
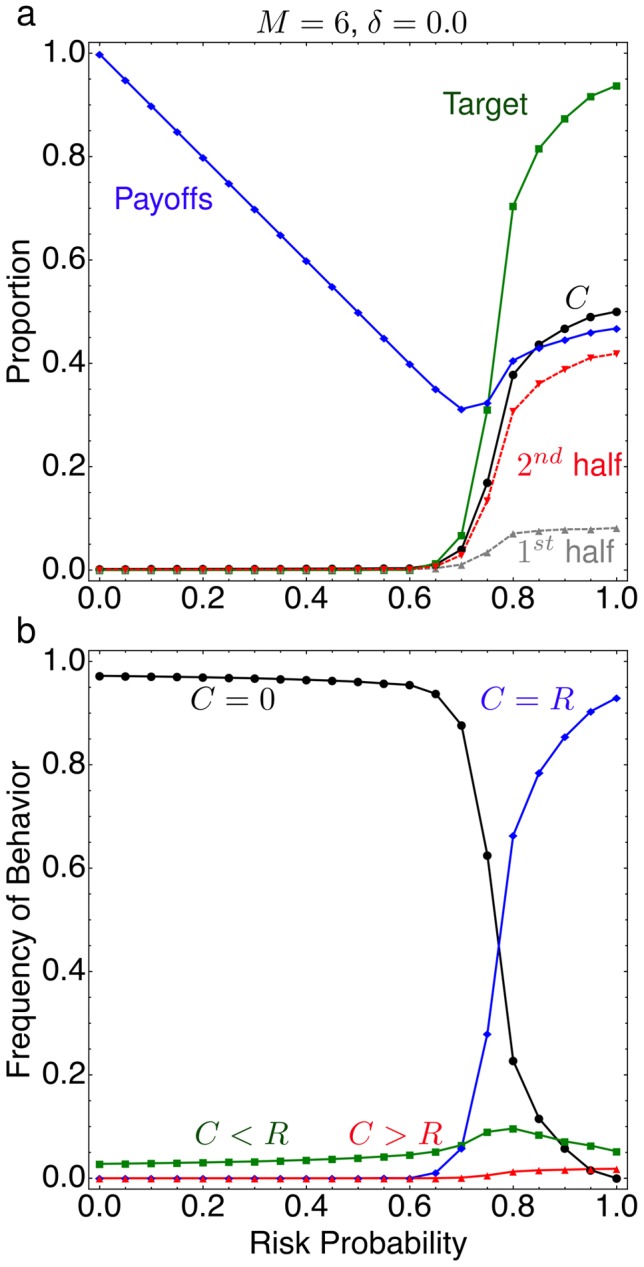
(a) The probability to meet the target investment, average payoff, total investment and investment in the first and second half of the game for different risk probabilities  (all payoffs and investments are measured in proportions of the total endowment). Players do not invest for
  , for
, for  , players invest up to half of their endowment, and at
  , more than half of the games meet the target. Investment mainly occur in the second half of the game. (b)The total investments in the game,
  behavior occurs at high frequencies for
  , while the
  behavior dominates for
  . Behaviors where
  occur for all
  at low frequencies, while over-contributors,
  , are also rare but only seen for very large
  (averages over
  generations from
  independent realizations parameters
  ,
,  ,
,  ,
,  ,
,  ,
,  ,
,  ).
).