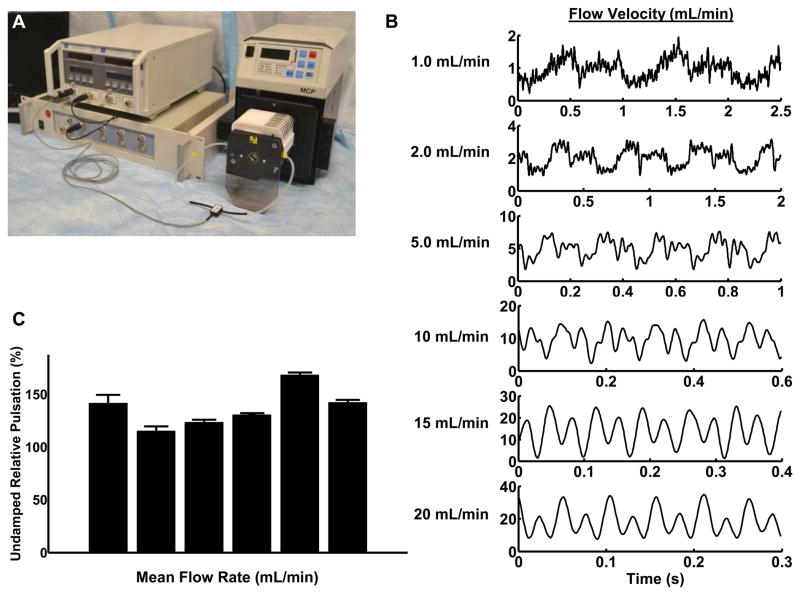
Figure 1. Baseline characterization of flow loop velocity profiles at different mean flow rates.
(A) Experimental set-up including an in-line ultrasonic flow probe with an analog-to-digital converter and software recording program was used to measure flow within the loop. (B) The magnitude and form of the flow from the peristaltic pump varied with the mean flow rate. (C) Pulsation of the pump varied with mean flow velocity. Quantitative measurement of relative pulsation was calculated as a ratio of minimum to maximum flow to the overall mean flow rate.

