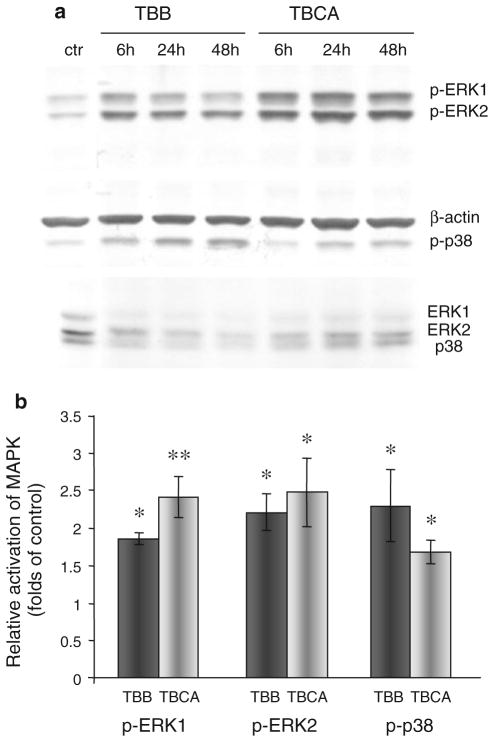
Fig. 6.
MAPK activation after CK2 inhibition. a Western analyses of activated signaling molecules ERK1, ERK2, and p38 MAPK after treatment of HBMVEC with CK2 inhibitors TBB and TBCA for 6–48 h. Phosphospecific p38 or ERK1 and ERK2 antibodies were used to visualize phosphorylated p38 MAPK and ERKs. Antibodies to β-actin or unphosphorylated ERKs and p38 were used to ensure equal loading. The typical blot is representative of three independent experiments. ctr, DMSO-treated control. b Quantitation of CK2 inhibitor-induced phosphorylation of MAPK. The bar graph represents average ± SEM of pooled values (n = 5) of densitometric scans. *P < 0.05, **P < 0.01 compared with control values (taken as 1) by paired two-tailed t test

