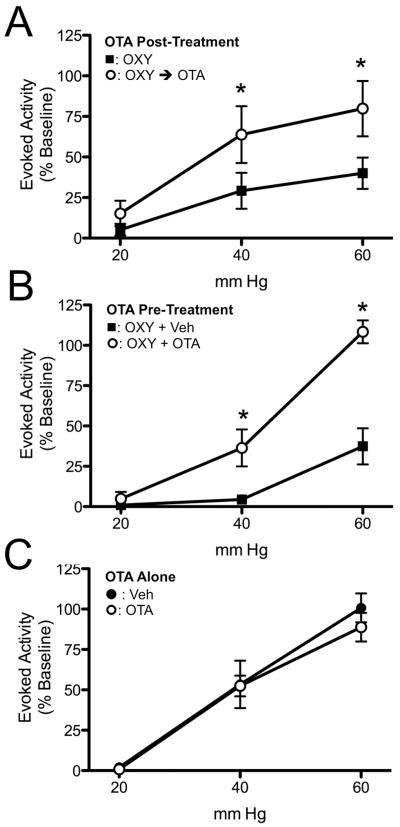
Figure 2.
Effect of oxytocin antagonist (OTA) on the OXY effect on VMR to UBD. Evoked activity is expressed as percent of EMG response to 60 mm Hg, 20s UBD prior to delivery of i.th. OXY. A: Ability of OTA to reverse the effect of previously given OXY. Stimulus-response curves in the same rats 60 minutes after i.th. OXY ■ and then 30 minutes later following i.th. OTA ○. * P < 0.05 versus OXY alone group. N = 5. B: Ability of OTA pre-treatment to block the effect of OXY. Stimulus-response curves in separate rats 30 minutes following i.th. delivery of 1.5 μg OXY plus vehicle ■ or 1.5 μg OXY plus 15 μg OTA ○. * P < 0.05 versus OXY group. C: Effect of i.th. OTA alone on VMR to UBD. Stimulus-response curves in separate rats 30 minutes following i.th. administration of vehicle ● or 15 μg OTA ○. N = 5 per group.

