
Figure 2.
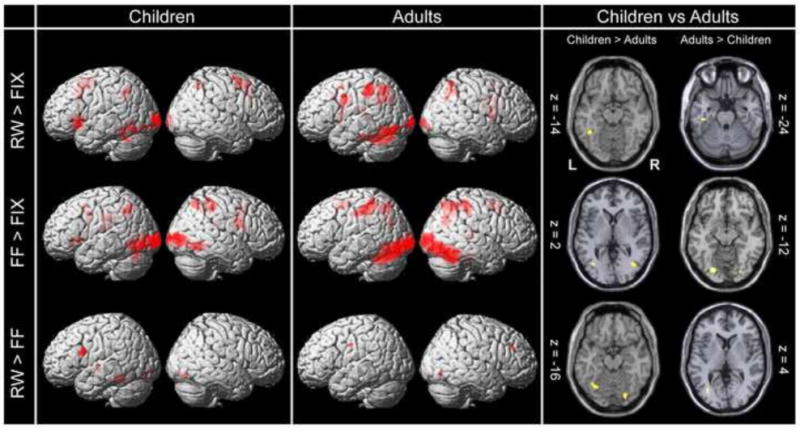
Group Whole Brain Activation maps. Left/Middle Within group activation maps for each of the task conditions relative to fixation (top and middle rows – p < 0.001; cluster-size corrected) and differential activation between real words and false-fonts (bottom – p < 0.001; uncorrected) for children and adults, surface rendered on the standardized MNI SPM template. Right: Between-group activations within the bilateral occipito-temporal cortices for each of the computed contrasts (p < 0.001 uncorrected). Z-coordinates were chosen based on the location of the peak activation within this region. L: denotes the left hemisphere, R: Right hemisphere. A full list of activation peaks is presented in Table 3.