
Figure 4.
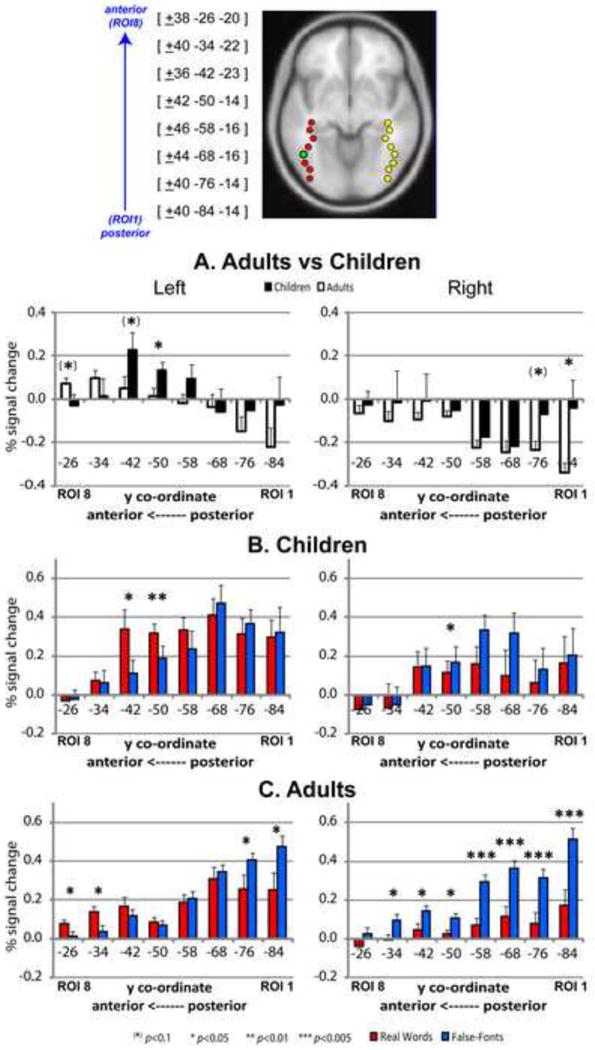
Region of interest analysis in the occipito-temporal cortex. Top: Spherical regions of interest selected in bilateral occipito-temporal regions. Each 4mm3 sphere contained approximately 33 voxels. ROI 4 (third from top - green) represents the co-ordinates located closest to the reported peak of the Visual Word Form Area. Middle/Bottom: Mean percent signal change values within the eight 4mm3 spherical regions of interest within left and right occipito-temporal regions for real words minus false-fonts in children (solid) and adults (clear - A) and for real-words (red) and false-fonts (blue) in children (B) and adults (C) separately. Error bars represent 1 standard error measurement.