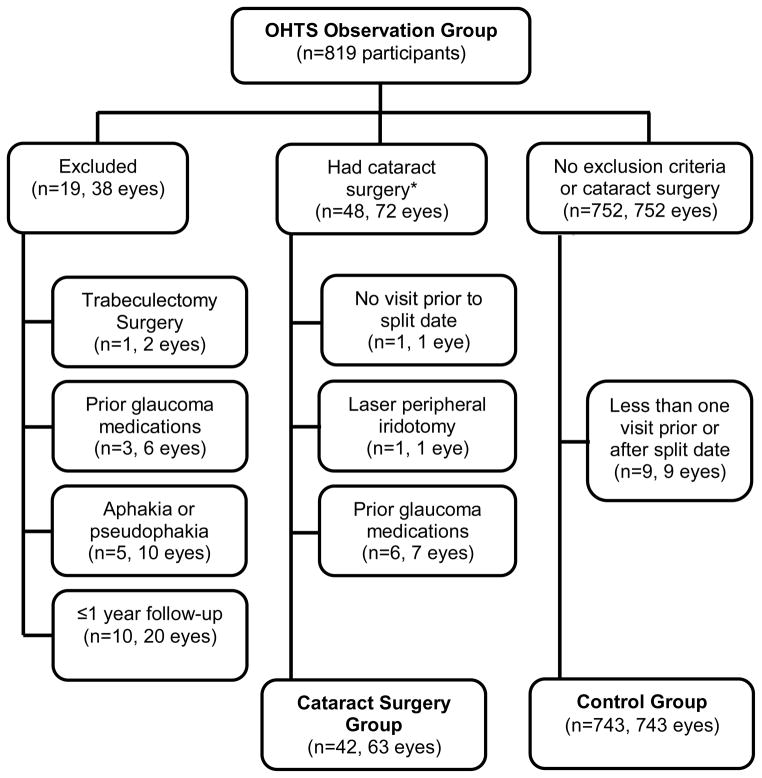
Figure 1.
Flowchart of participants included into the current report of the Intraocular pressure (IOP) change after cataract surgery in the Ocular Hypertension Treatment Study (OHTS). The cataract group includes 63 eyes of 42 participants who had cataract surgery and the control group includes 743 eyes of 743 participants. Split date is the date that the participant reported cataract surgery. *Two participants in the cataract group had more than one exclusion criteria.

