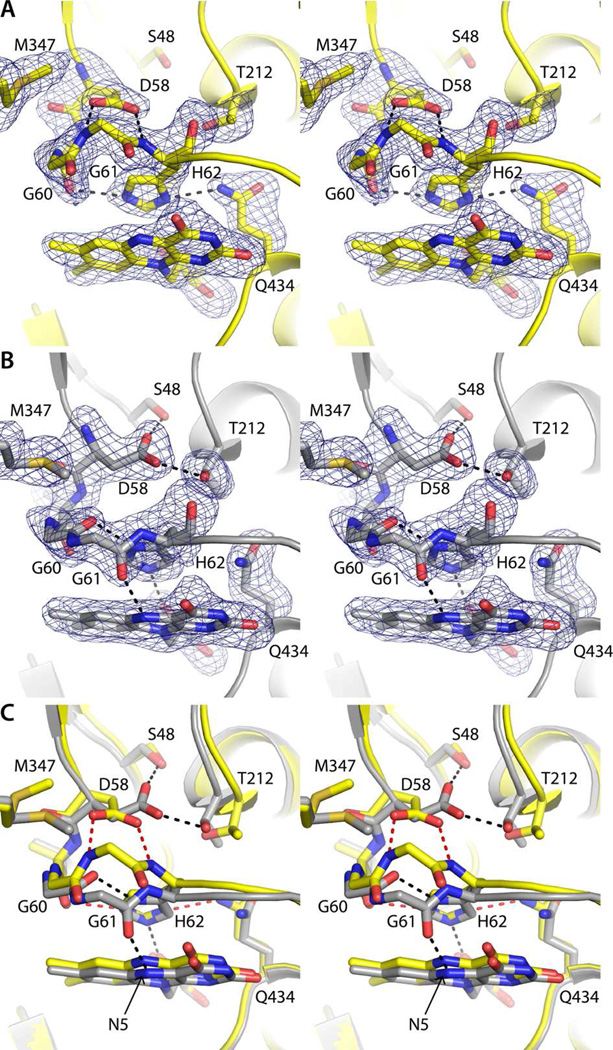
Figure 4.
Structural changes induced by FAD reduction (stereographic views). (A) Electron density for the histidine loop region of oxidized TcUGM. The cage represents a simulated annealing σA-weighted Fo − Fc omit map contoured at 3 σ. (B) Electron density for the histidine loop region of reduced TcUGM. The cage represents a simulated annealing σA-weighted Fo − Fc omit map contoured at 3 σ. (C) Superposition of oxidized (yellow) and reduced (gray) TcUGM. Red and black dashes represent hydrogen bonds for oxidized and reduced TcUGM, respectively.

