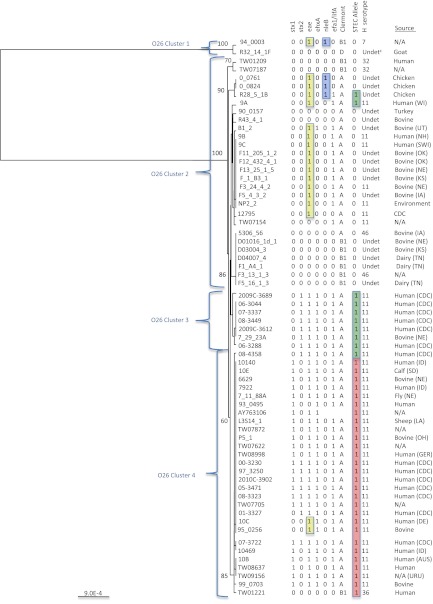
Fig 2.
UPGMA tree of the O-antigen gene clusters from 65 O26 Escherichia coli strains. Bootstrap values are presented on the corresponding branches, and clusters are in parentheses. EPEC strains are highlighted in yellow, strains with the nleB gene are highlighted in blue, highlighted in green are strains with the T STEC allele for polymorphism wzx 953 G→T, and highlighted in red are strains with the G and A STEC alleles for polymorphisms rmlA 30 G→T and fnl1 88 G→A. The unit of measure for the scale bar is the number of nucleotide substitutions per site. SWI, Switzerland; DEU, Germany; AUS, Australia; URU, Uruguay; N/A, not available. Two-letter abbreviations are postal abbreviations for U.S. states.

