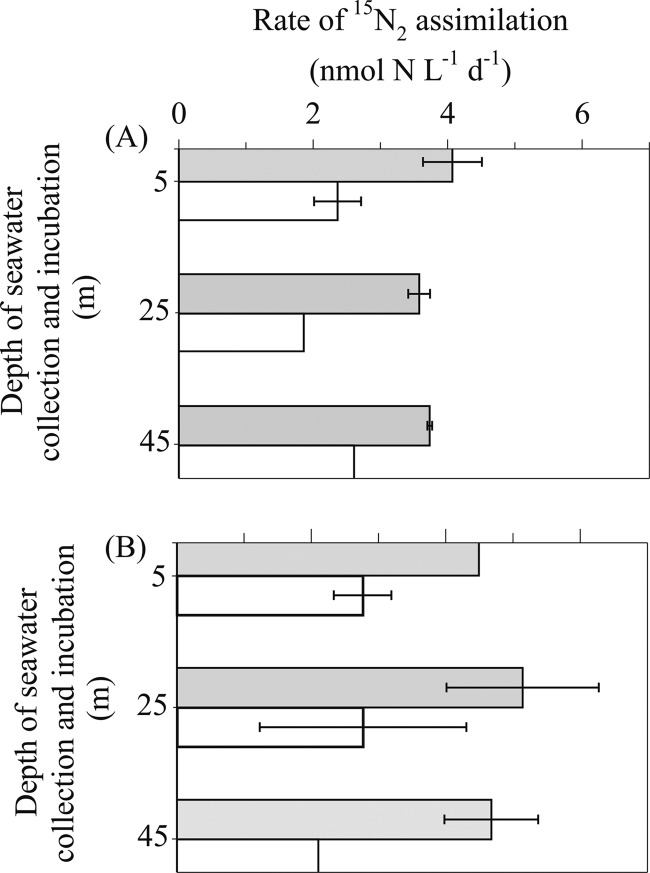
Fig 7.
Depth profiles of N2 fixation rates at Stn ALOHA incubated in situ for 24 h using a free-drifting array on two separate occasions: 20 July 2011 (A) and 31 August 2011 (B). The 15N2 tracer was either added as a gas bubble (open bars) or in dissolved form (gray bars). Error bars where shown represent standard deviation (n = 3).

