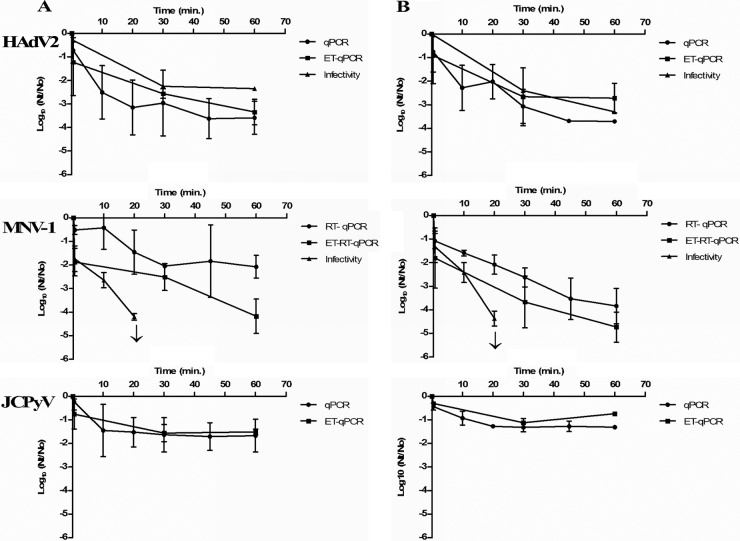
Fig 2.
Log reduction curves for seeded HAdV2, MNV-1, and JCPyV in natural (A) and artificial (B) seawater treated with free chlorine at 2.5 mg/liter (initial concentration). Each data point is an average of two independent experiments, except in the case of HAdV2 infectivity, where the values correspond to one experiment. ↓, Detection limit.

