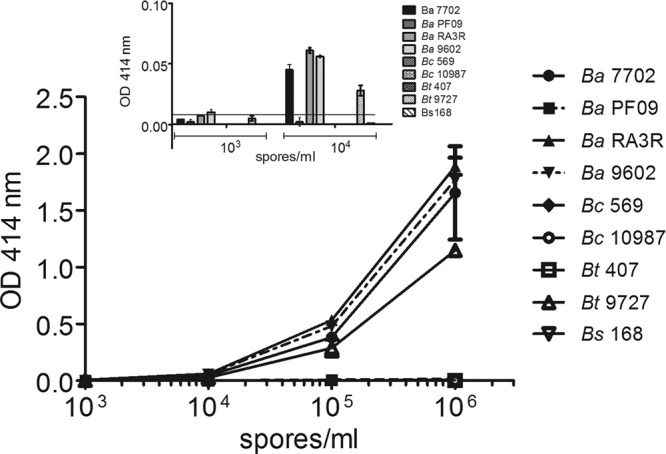
Fig 4.

Standard curves for various Bacillus strains in PBS–0.1% BSA buffer. Immunoassays were performed with A1 as the capture antibody and R93 as the AChE tracer antibody. The bacillus concentration range was 103 to 106 spores per ml. The inset shows the low-concentration part of the curve. The nonspecific binding of each MAbs was subtracted. OD, optical density.
