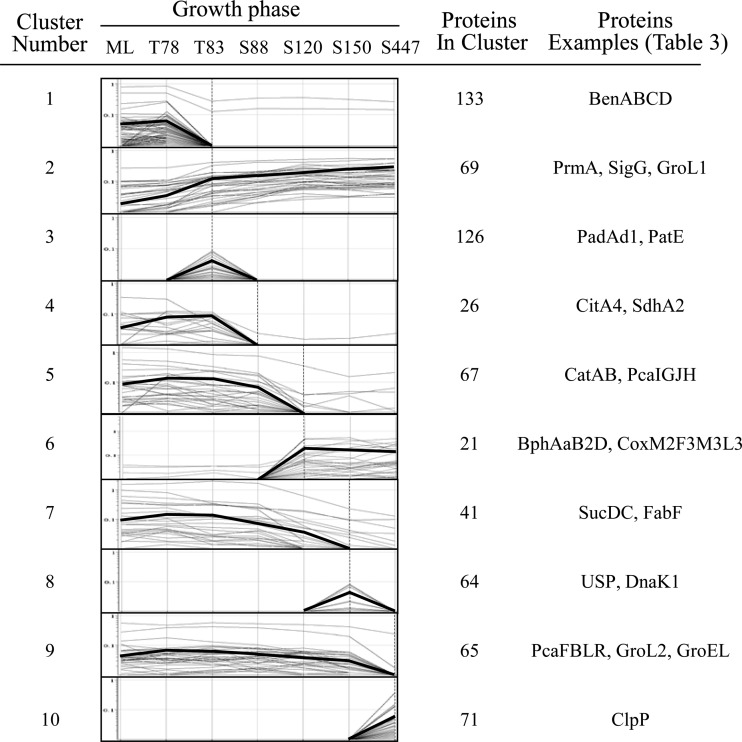
Fig 4.
Hierarchical cluster analysis of protein spot signal intensities for the RHA1 proteomes. Protein signal intensities from averaged triplicate samples were obtained by using Progenesis and exported into GeneSpring software for cluster analysis. Proteins with similar signal intensity patterns were grouped together into 17 clusters, of which 10 are shown. The thick lines represent the average profiles.

