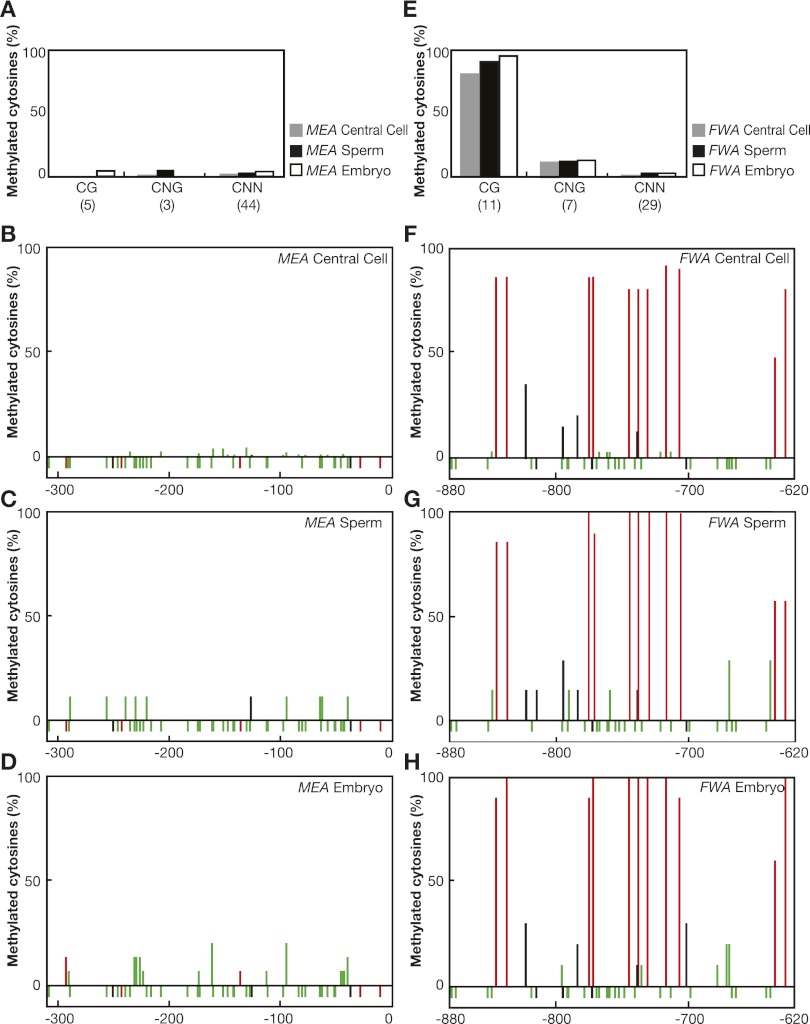
Figure 5.
Promoter methylation of MEA and FWA. (A,E) Percentage of cytosine methylation at CG, CNG, and CNN sites in the MEA promoter (A) and the FWA promoter (E). DNA was isolated from central cells, sperm cells, and two-cell stage embryos; bisulfite-treated; sequenced; and analyzed. Numbers in brackets indicate the number of sites present in the investigated promoter region. (B–D,F–H) Percentage of cytosine methylation at each position is indicated with a red (CG), black (CNG), or green (CNN) bar. Unmethylated cytosines are shown below the 0% line. Numbers are relative to the translational start site and indicate the investigated promoter region.

