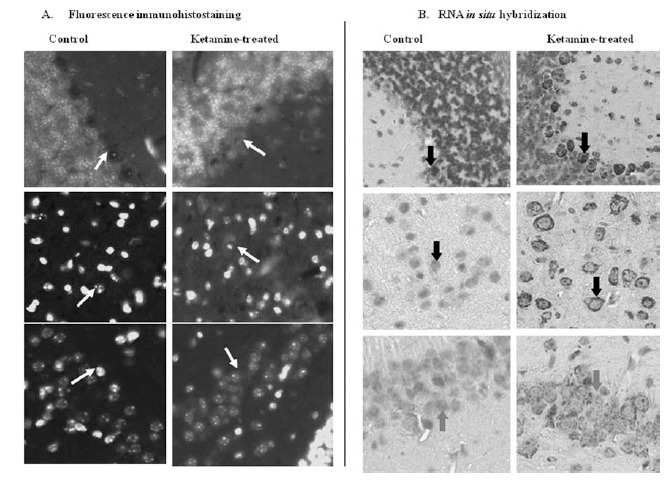
Fig. (5). Comparison of protein and RNA expression of Tnnt1 in brain tissue of mice treated with ketamine.

(A) Fluorescence immunohistostaining. Fluorescence red cytoplasm staining indicated Tnnt 1 protein expression. (B) RNA in situ hybridization. Dark gray cytoplasm staining indicated Tnnt 1 RNA expression. Top panels: Purkinje cells of cerebellum; middle panels: pyramidal cells; bottom panels: Hippocampus. The indication of arrows: Top panels: Purkinje cells; middle panels: pyramidal cells; bottom panels: hippocampus. (Magnification: 40X). (Reprinted from NeuroToxicology 30 (2009) 261–268, Lowe et al., Fig. (4)[32], with permission from Elsevier).
