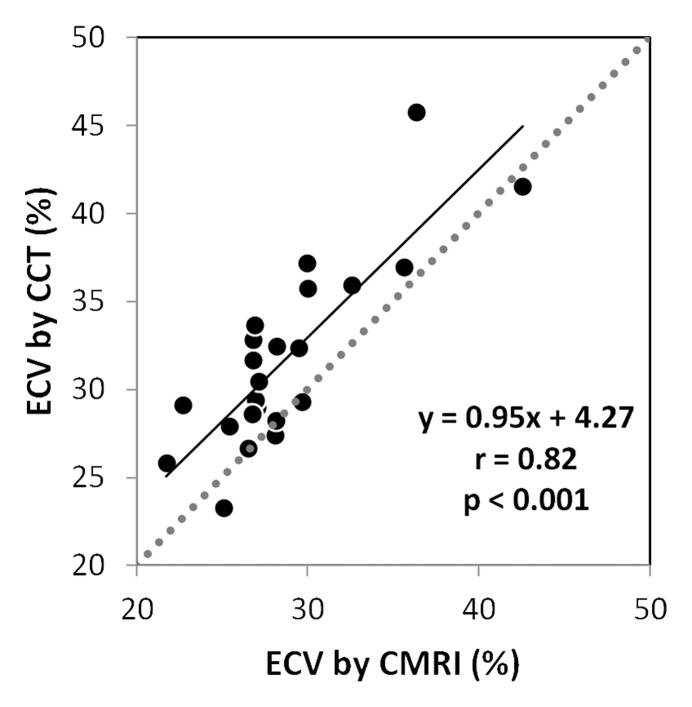
Figure 3a:
Results obtained for ECV at (a) MR imaging and (b) CT. (a) Correlation and linear regression analysis shows good correlation between the methods (r = 0.82, P < .001). (b) Bland-Altman plot shows a small bias (3.01%) toward higher ECV at cardiac CT (black line), with 95% limits of agreement between the two methods of −2.82% and 8.85% (thick gray lines).

