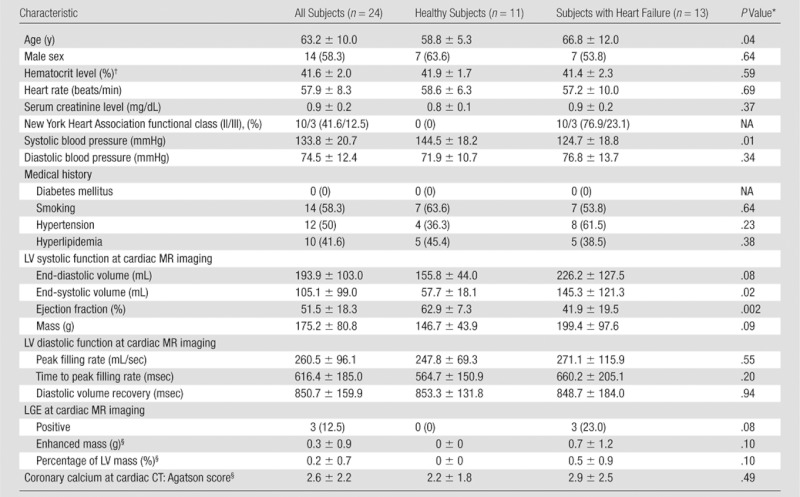
Table 1.
Participant Characteristics

Note.—Data are mean ± standard deviation or number of patients with percentages in parentheses, as appropriate. LGE = late gadolinium enhancement, LV = left ventricular, NA = not applicable.
P values are for comparison of healthy subjects with those with heart failure.
To convert to Système International units (proportion of 1.0), multiply by 0.01.
To convert to Système International units, (micromoles per liter), multiply by 88.4.
Results are from logistic regression analysis.
