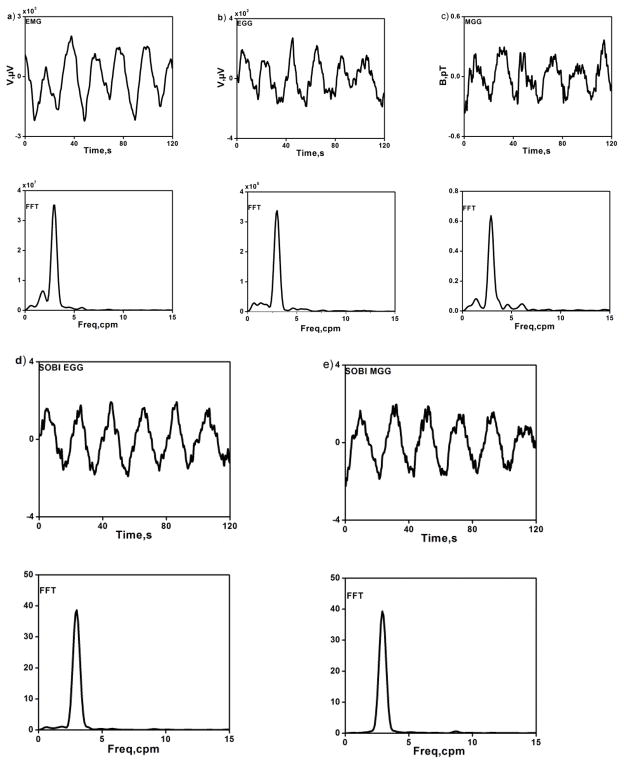
Figure 2.
(a–c) Electromyogram (EMG), electrogastrogram (EGG) and magnetogastrogram (MGG) filtered data (upper row) and their corresponding frequency spectra (lower row) during postprandial period. (d–e) EGG and MGG components isolated with SOBI (upper row) and their corresponding frequency spectra (lower row).

