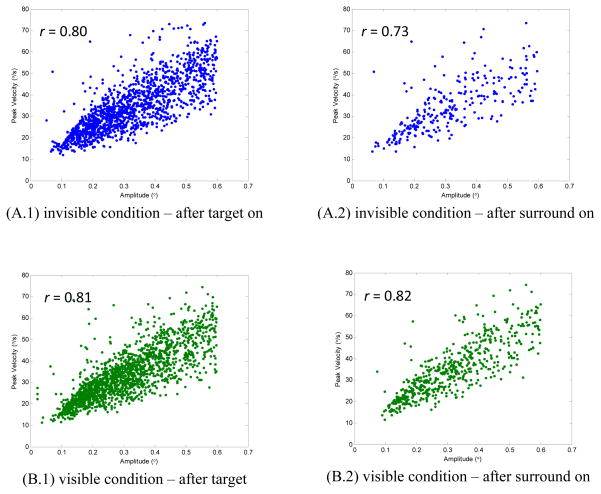
Figure 2.
Peak velocities of microsaccades as a function of amplitude (“main sequence”). Panel A shows the results in the invisible condition. The plot (A.1) contains 1440 microsaccades from all three monkeys, which were detected between target on and 1000 ms posterior to the surround onset. The correlation coefficient was 0.80. Specifically, the relationship of the 279 microsaccades detected after surround onset in the same condition was shown in the plot (A.2) with the correlation coefficient of 0.73. Panel B shows the results in the visible condition. The plot (B.1) contains 1770 microsaccades (r = 0.81), while the plot (B.2) contains 581 microsaccades (r = 0.82).

