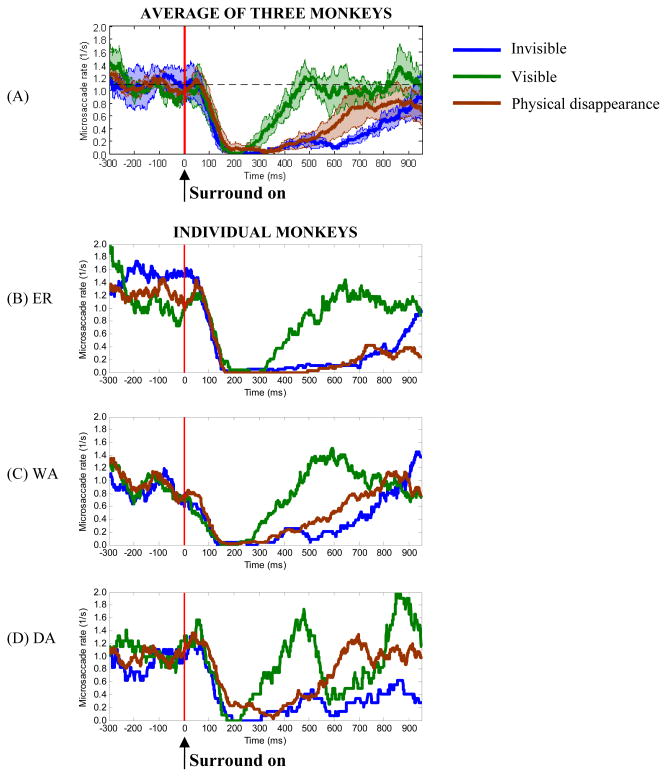
Figure 5.
Evolution of microsaccade rates in the conditions of “invisible”, “visible” and “physical disappearance” (physical removal of the target). Panel (A) shows the average microsaccade rates between 300 ms before and 950 ms after surround onset as a function of time. The horizontal dashed line represents the average microsaccade rate in the interval of −300 ms to 0 ms (1.08 1/s). The vertical red line displays the onset of surrounding patterns. Shadows around the mean indicate confidence bands of ± 1 SEM between monkeys (n = 3). The average rates from individual monkeys per condition are shown in panels (B) – (D). The rate of microsaccades has been calculated in a window of 100 ms width moving in 1 ms steps.

