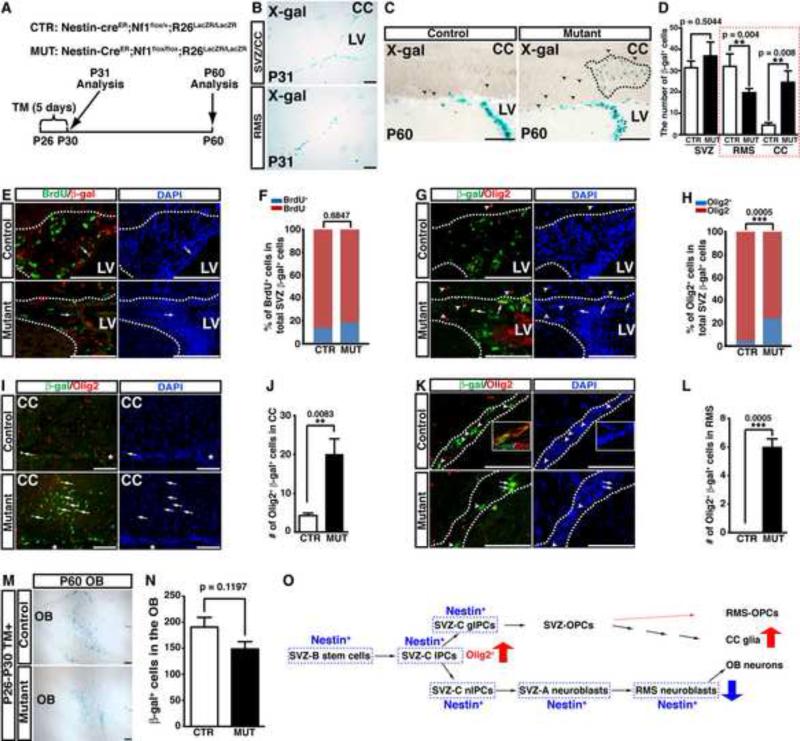
Figure 4. Acute inactivation of Nf1 induces a glia/neuron fate switch in the adult SVZ.
(A) The summary of the genotypes of inducible mouse models and the time frame of tamoxifen (TM) induction and analysis. (B) Young adult mice were induced by TM from P26-P30 and analyzed at P31. The cells undergoing Cre-mediated recombination revealed by X-gal staining were restrictedly distributed in the SVZ and RMS. (C-N) Control and mutant brains induced by TM from P26-P30 were analyzed at P60. (C) X-gal staining of the SVZ/RMS/CC system shows the cluster of β-gal+ cells (dashed lines) exclusively identified in the mutant CC. Arrowheads identify individual β-gal+ cells in the CC. (D) The number of β-gal+ cells in the control and mutant SVZ/RMS/CC was quantified. (E, F) The proliferation rate of β-gal+ cells marked by BrdU staining was not significantly different between the control and mutant SVZ. (G-L) The β-gal+ cells coexpressing Olig2 in the control and mutant SVZ (G, H), CC (I, J) and RMS (K, L) are identified by arrows and quantified. Arrowheads label non-colocalizing cells. The inset in (K) shows the coexpression of β-gal and Dcx in the control RMS. Dashed lines delineate the SVZ and/or RMS region. (M) The OB from TM-induced control and Nf1NcreERCKO brains was stained with X-gal and compared. The number of β-gal+ cells was quantified (N). (O) An illustration summarizes the cell lineages targeted by Nestin-creER and their respective derivatives. All the quantification data are presented as mean ± SEM. LV, lateral ventricle. Scale bars: 50 μm. See also Figure S5.

