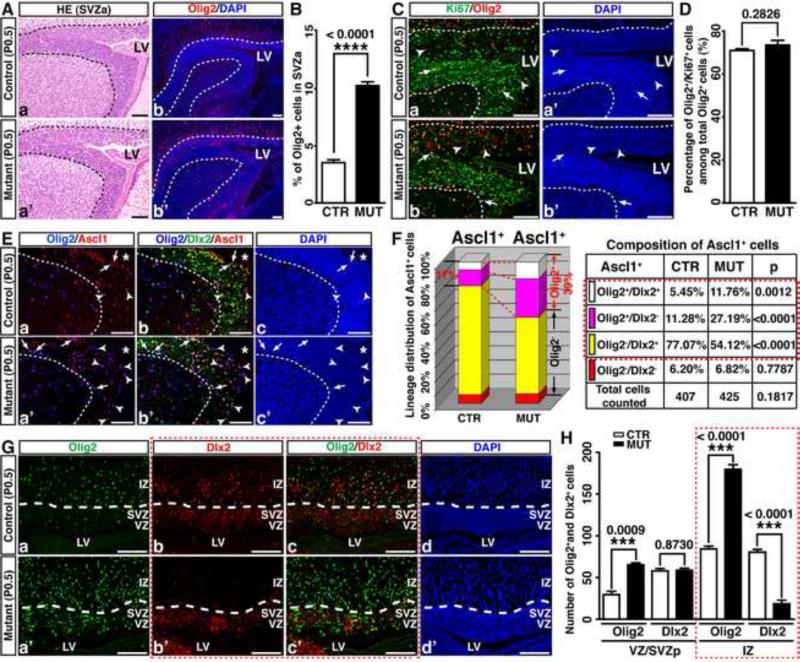
Figure 5. Nf1 inactivation leads to ectopic expression of Olig2 in neural stem/progenitor cells in neonatal brains.
(A) Sections from P0.5 control and Nf1hGFAPCKO brains were stained with H&E (a, a’) and Olig2 (b, b’). (B) The percentage of Olig2+ cells in the anterior SVZ (SVZa) was quantified. (C, D) The proliferation rate of Olig2+ cells was not significantly different between the control and mutant SVZa. Arrows and arrowheads: Olig2+/Ki67+ and Olig2+/Ki67-cells. (E, F) The percentage of Ascl1+ cells coexpressing Olig2 and/or Dlx2 in the control and mutant SVZa was analyzed and quantified. Arrows and arrowheads: Olig2+/Dlx2+/Ascl1+ triple-positive cells and Olig2+/Dlx2-/Ascl1+ double-positive cells. (G, H) The expression of Olig2 and Dlx2 in the posterior control and mutant VZ/SVZ and IZ was analyzed and quantified. Dashed lines demarcate the SVZa (A, C, E) or VZ/SVZ regions from the IZ (G). All the quantification data are presented as mean ± SEM. LV and *, lateral ventricle. IZ, intermediate zone. Scale bars: 50 μm. See also Figure S6.

