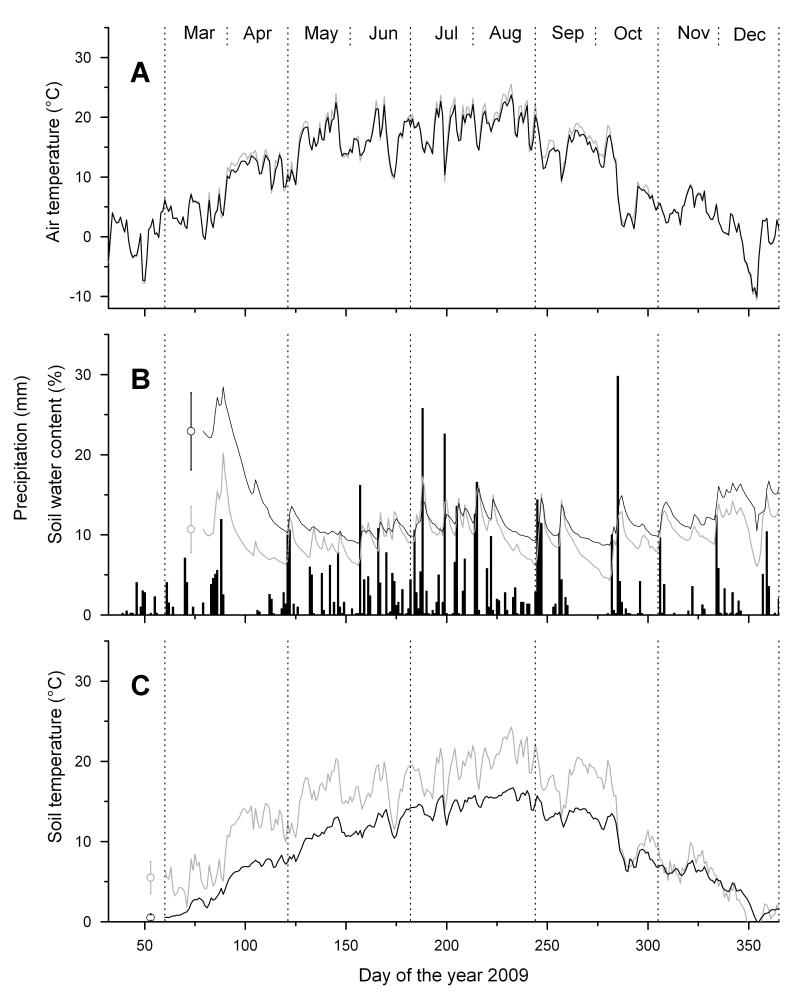
Fig. 1.
Climate variables recorded during the growing season 2009 within the study area. A Mean daily air temperature; B Daily precipitation sum (bars) and mean daily soil water content; C Mean daily soil temperature. Study sites are denoted by grey and black lines for the xeric and dry-mesic site, respectively. Mean standard deviations among soil moisture and soil temperature sensors (n = 3) are indicated.

