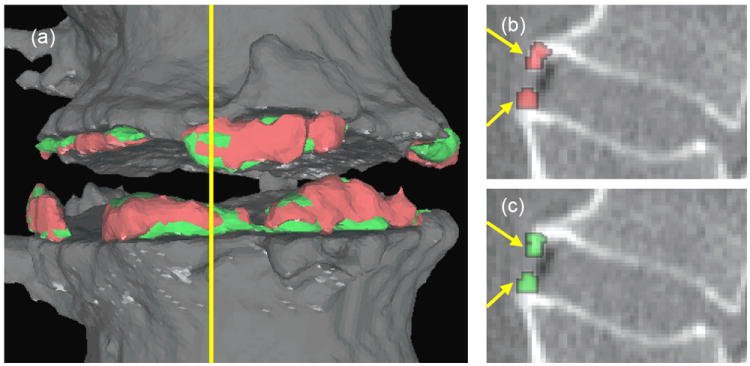
Figure 11.

Comparison between manual (red) and automated (green) segmentation of syndesmophytes. (a) is a 3D surface reconstruction. (b) is a sagittal slice showing the manual segmentation and (c) is the same sagittal slice showing the automated segmentation. The yellow line in (a) indicates the position of the sagittal slice. The overlap similarity index in this example is 0.77.
