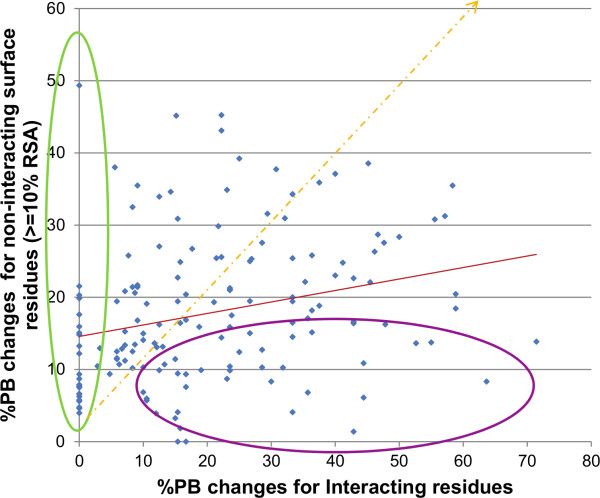
Figure 4.
Scatter plot of PBc for interacting residues vs. rest of surface residues for PPC dataset. Proteins showing higher proportion of PB changes at the interface are encircled in purple whereas proteins showing PB changes in the non-interacting surface region when the interacting region remains unaltered are encircled in green. This plot reveals the existence of several protein-protein complexes which exhibit substantial conformational changes at non-interacting surface regions even though the interface region is largely unmodified (shown in green circle).

