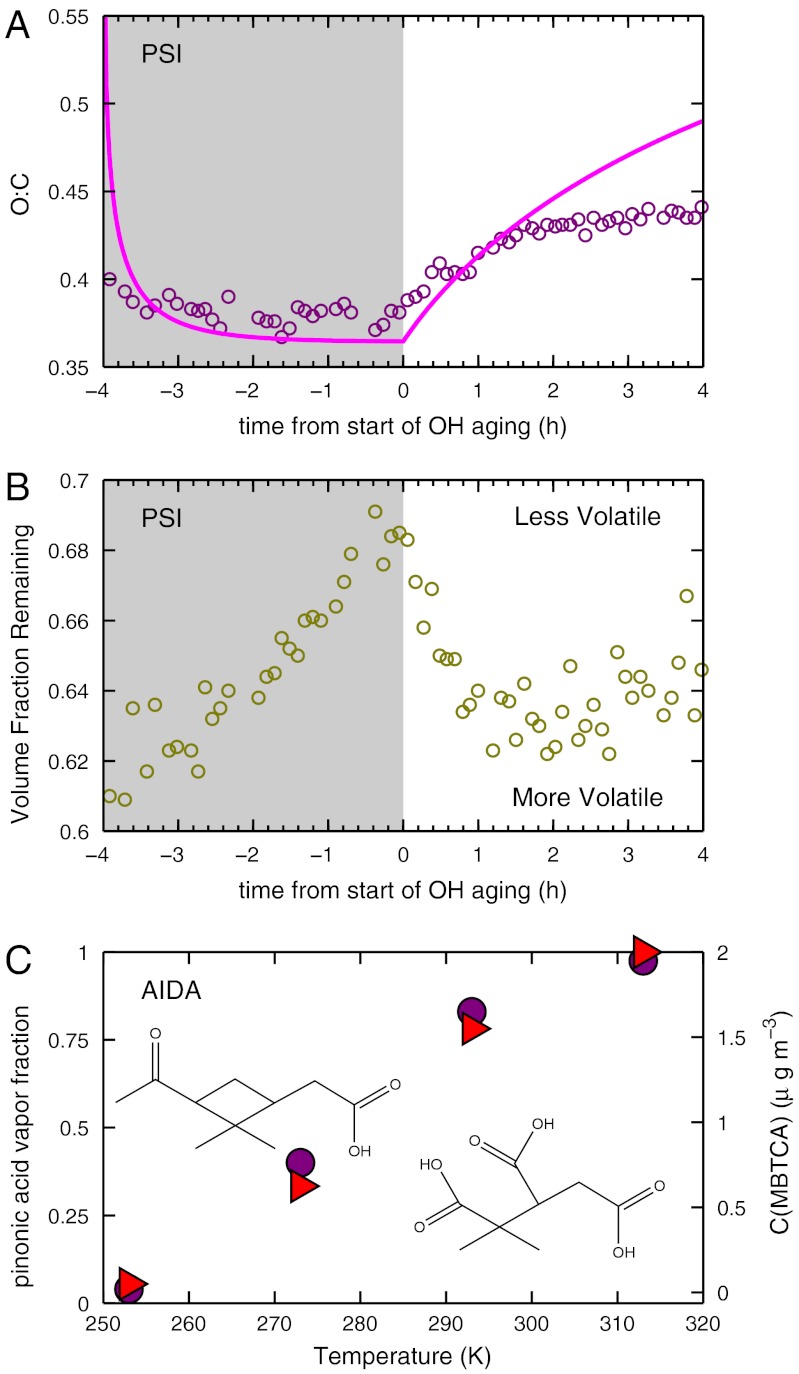
Fig. 3.
Additional changes to SOA properties and constituents during OH aging experiments. (A) Typical evolution of molar oxygen to carbon ratio (O∶C, magenta circles) modeled with the 2D-VBS (magenta curve). The model reproduces the increase in O∶C for the first 1.5 h well. Afterwards model and measurements diverge, either because oxygenation in the model is too aggressive or because OH levels (and consequently aging) declined later in the experiment. The sharp early drop in the model before t = - 3 h arises from fresh SOA growth; the least volatile constituents have the highest O∶C. (B) Volatility data combine a steady decrease in volatility (increase in volume fraction remaining) unrelated to OH exposure with a sharp increase in volatility immediately after OH exposure, suggesting that fresh semi-volatile SOA addition dominates over aging of existing semi-volatile SOA. (C) Gas-phase fraction of cis-pinonic acid (magenta circles) and levels of MBTCA (red triangles) vs. temperature in AIDA. Separate experiments with pure cis-pinonic acid showed conclusively that MBTCA is formed from cis-pinonic acid oxidation by OH in the gas phase. These results show that as the cis-pinonic acid is sequestered in the condensed phase at low temperatures, the MBTCA formation is reduced proportionally.

