Fig. 3.
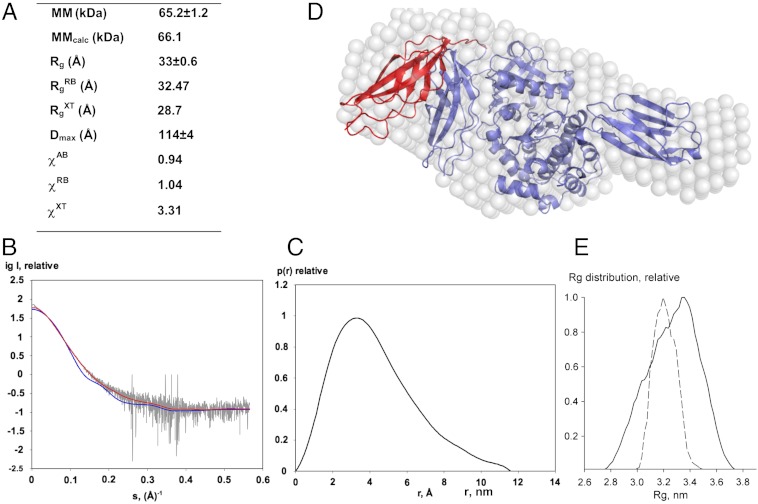
SAXS analysis. (A) Molecular parameters calculated from SAXS data. MM, Rg, Dmax denote the molecular mass, radius of gyration, and maximum size, respectively. Parameters without superscripts are experimental values; superscripts AB, RB, and XT refer to ab initio and rigid-body fitted models (shown in D) and the crystal structure, respectively. MMcalc is the theoretical MM computed from the protein sequence. χ is the discrepancy between experimental data and those computed from models; (B) SAXS data are displayed as dots with error bars (grey), while curves computed from the crystallographic (blue) and the RB model shown in (D) (red) are given as solid lines; (C) Distance distribution function; (D) Ab initio (white spheres) and RB (red) models are shown superimposed on the crystal structure (blue). In this RB model, only domain Fn31 was permitted to vary its position, while the rest of the molecule was fixed; (E) Rg distributions for models from a random pool of 105 structures (solid line) and optimized by EOM (dashed line).

