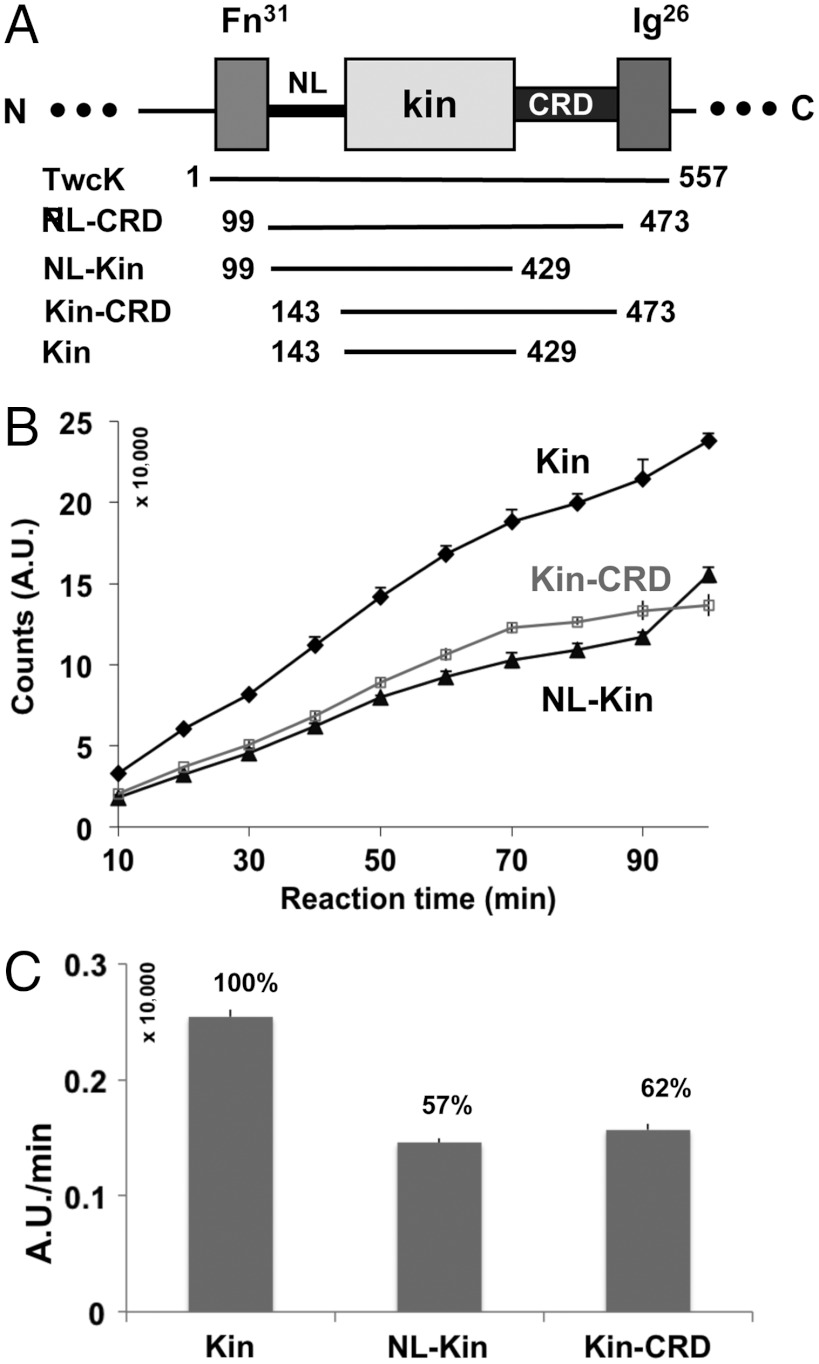
Fig. 4.
TwcKR catalytic activity. (A) Domain boundaries of segments tested; (B) Diagram of catalytic traces and (C) relative enzymatic activities calculated by linear regression using points in the linear range (10–30 min; linear fit R2 > 90%). Full-length TwcKR and the NL-kinase-CRD construct were similarly inactive and their activity unquantifiable. Thus, they are not explicitly plotted here.

