Fig. 3.
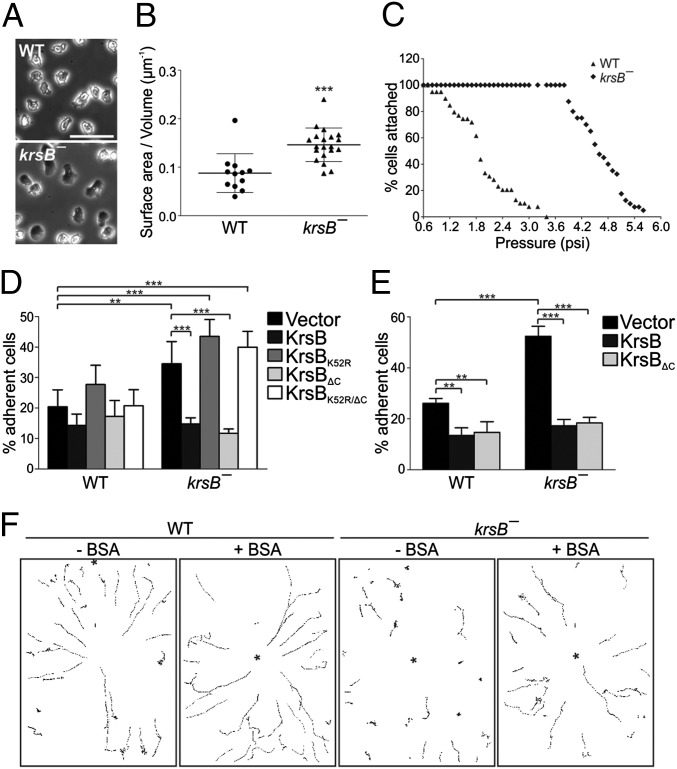
Increased spreading and adhesion of krsB− cells is responsible, in part, for their defective chemotaxis. Analysis was performed on WT and krsB− cells. (A) Phase-contrast images of vegetative cells in glass-bottomed chambers in growth medium. (Scale bar: 50 μm.) (B) Vegetative cells expressing cAR1-mCherry were plated in glass-bottomed chambers in phosphate buffer, and serial sections were imaged with a spinning disk confocal microscope. The area of each slice from 12 WT and 20 krsB− cells was measured to derive the surface area-to-volume ratio. Data are shown as mean ± SD; ***P < 0.001. (C) Vegetative cells were loaded into a microfluidic device, exposed to constant flow with pressure increasing by 0.1 psi every 2 min, and imaged every 30 s. The percentage of cells remaining attached to the surface was calculated before each pressure increase. (D and E) Vegetative cells expressing either empty vector or the indicated C-terminally GFP-tagged KrsB constructs were subjected to a rotational adhesion assay at 150 rpm (D) or 100 rpm (E). Data derived from four (D) or three (E) separate experiments, each performed in duplicate, are shown as mean ± SE; **P < 0.01; ***P < 0.001. (F) Aggregation-competent cells plated in glass-bottomed chambers with or without 0.2% BSA coating were exposed to a micropipette filled with 10 μM cAMP and were imaged every 15 s for 20 min. Tracks of individual cells over the 20-min period are shown. (Scale bar: 100 μm.)

