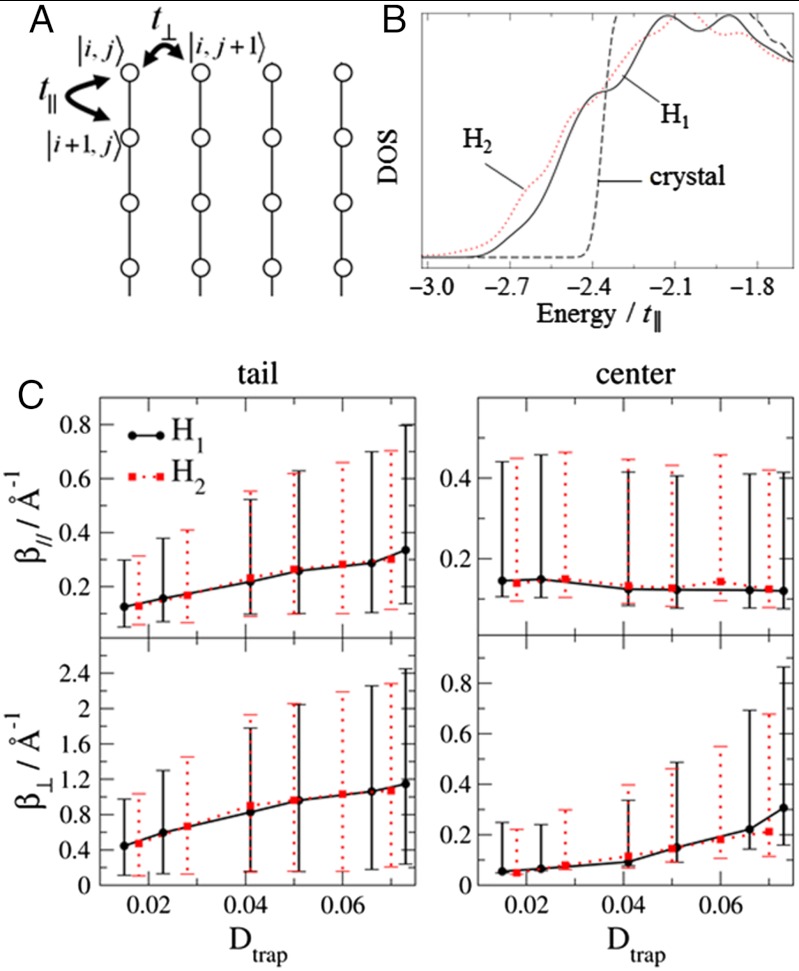
Fig. 4.
(A) A scheme of the model tight-binding disordered Hamiltonian. (B) The tail of the DOS for model H1 and H2 compared with the DOS of the perfect crystal. The disorder parameters were tuned to have the DOS below the conduction band Dtrap comparable with experiment and numerical simulations. (C) Computed values of attenuation factor from the two considered models, H1 and H2. For each model, the attenuation factor was evaluated at the tail of the DOS (Left) and at the center (Right), both in the parallel (Top) and perpendicular (Bottom) direction. As the βs are non-normally distributed, their median and interquartile range are represented by the filled symbols and the error bars in the plot.

