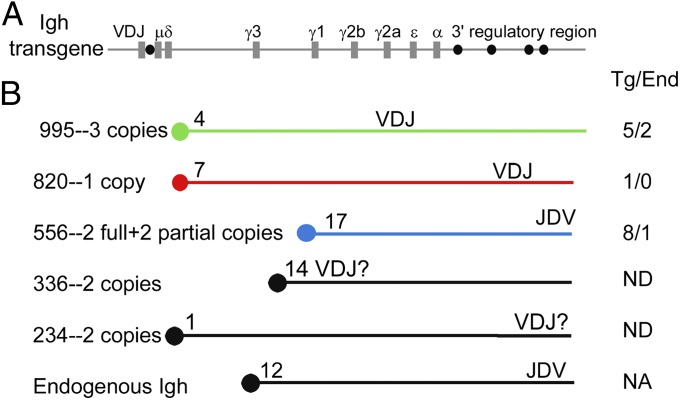
Fig. 1.
Myc:Igh translocations. (A) Structure of the 230-kb Igh transgene. Coding exons are depicted as gray rectangles, and regulatory elements are depicted as black circles. The transgene is drawn approximately to scale. (B) Five transgenic lines used in this study are shown, with copy number, a schematic of chromosome location, and transgene orientation relative to the centromere depicted by the orientation of the VDJ exon. The location of the endogenous Igh locus on Chr 12 is shown for comparison. To the right of the chromosome schematics is shown an enumeration of Myc:Igh translocation sites cloned from in vitro cultures. Translocation to the transgene or to the endogenous genes (number of sequences of each type shown, separated by a slash) was determined by evaluating three to 52 polymorphisms in the various S regions (see SI Materials and Methods for sequence data and methods).

